

 Illuminate Blog
BI Tool: Disrupting Inequities
Welcome to a new year of our BI Tool blog, where Illuminate BI Tool users can share the incredible work that is being done by BI Tool users all over the country. I am extremely grateful to the inspiring educators who are doing this important work with the BI Tool and also taking the time to share their work with the larger BI Tool User Community. A big thank you to everyone who has contributed to the blog thus far!
In our previous post, Jimmy Hoang at Berkeley Unified highlighted his “Quick Lookup” report that displays student grades and attendance data by period, side by side on one screen. Jimmy put it best: “This screen is vital for teachers, counselors and other support staff to easily look at trends, then determine and provide students with necessary support.” If you missed it, read all about it here.
To start the new year, we are honored to have Sacramento City Unified School District (SCUSD) contribute a blog post that focuses on how SCUSD is using the BI Tool to “disrupt the inequities that have long existed in its system.” SCUSD’s “Student Behavior (YTD)” BI Tool report, meticulously created by Jacob Walker, visualizes a summary of behavior data by grade level, ethnicity & race, program participation, time of day, day of the week, location, behavior type, and more! Most importantly, the report spotlights the most frequently used responses to the behavior so SCUSD’s school leaders can remain aware of and easily monitor how they are responding to the behavior. As Jacob puts it, “Seeing the data is the first step to improving the data.”
SCUSD’s work with the BI Tool really demonstrates the flexibility of Illuminate’s Education Intelligence platform when combined with the power of Illuminate’s BI Tool. SCUSD does not use Illuminate’s SIS, but nevertheless, is still able to use Illuminate to visualize the data and make it easily accessible to stakeholders. By importing the behavior data from their SIS (Infinite Campus) into Illuminate “Summary Assessments” which are essentially limitless repositories for student data, SCUSD is able to take full advantage of Illuminate’s strengths. We are heartened and energized by Jacob’s remark: “Without a doubt, I can say that BI Tool is the most powerful education-specific reporting tool that I have come across in the educational sphere.” Read all about SCUSD’s “Student Behavior (YTD)” report below!
Please join Illuminate’s BI Tool User Community to collaborate with Illuminate BI Tool users throughout the country. Simply follow this link and click the “Follow” button at the top. (To participate in the forum, login to Illuminate, click your “Control Panel,” select “Illuminate Help Center,” and click on “Community.”)
If you are interested in contributing to the BI Tool Blog, please email me at: freyherme@illuminateed.net
Sincerely,
Franck Reyherme
Director of Business Intelligence Services
Illuminate Education
*****
Disrupting Inequities: The “Student Behavior (YTD)” Report
By: Jacob Walker, Sacramento City Unified School District
Sacramento City Unified School District (SCUSD), under the leadership of the Board of Education and Superintendent Aguilar, is working to disrupt the inequities that have long existed in its system. A major part of this is to use data to its fullest potential, because as Superintendent Aguilar is known for saying “We treat data with ultimate respect because behind every numerator is a child.” I joined SCUSD’s Strategy and Continuous Improvement team to help with this data work about 6-months ago, having a broad background in Education, Information Technology work, and data analysis.
The district operates with a guiding principle that ensures all students are given an equal opportunity to graduate with the greatest number of postsecondary choices from the widest array of options.
One clear area of inequity in our district is the suspension of African American Males, where each year, one out of five African American males are suspended. To better understand and resolve the behavior and discipline issues that our district has, our team was tasked visualizing behavior and discipline data from our student information system (Infinite Campus), and producing a flexible summary report using Illuminate’s business intelligence (BI) Tool. The Student Behavior (YTD) report is the first of a variety of tools to be developed as part of our suite of Attendance, Behavior, and Course performance (ABC) reports. To ensure alignment with industry standards, we modeled the Student Behavior (YTD) report after the PBIS School-Wide Information System (SWIS). The report is designed to provide actionable information to monitor and support school-wide behavior medication in the most efficient and effective manner within site’s allocation of limited resources.
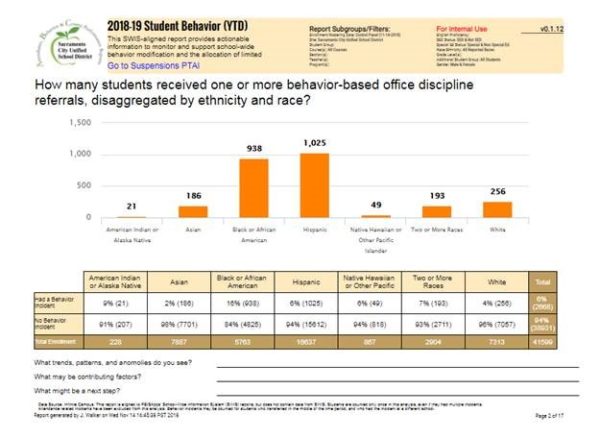
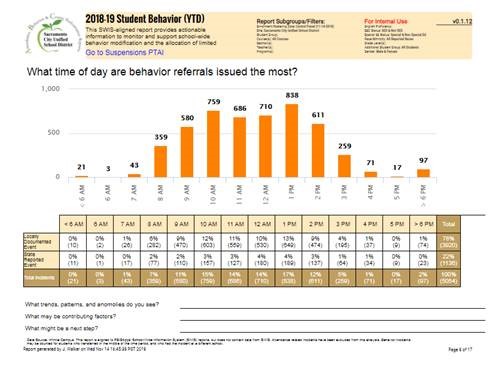
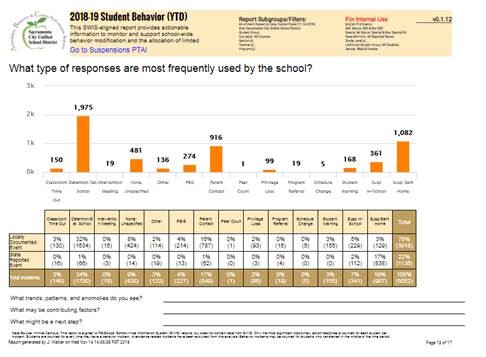
Our report first shows how many students are receiving behavior referrals to the office, disaggregated by grade level, ethnicity and race, then by specific Asian race, and by program participation (English learners, foster youth, homeless students, socioeconomically disadvantaged students, and students participating in Special Education). It also shows which behavior referrals are reported to the state and which are only locally documented. We then are able to show which locations and times that behavior referrals occur, and the response that the schools have to these behaviors, including PBIS as well as traditional discipline (detentions, suspensions, etc.)
Each of these is shown with a column chart, and a crosstab table below, which displays both the total numbers as well as percentages. We used a color scheme of orange and brown, with the orange being used to represent caution.

The report facilitates a deeper diver into our behavior and discipline data by using filters, and also by seeing trends, we hope our principals will be able to better allocate their limited resources. Seeing the data is the first step to improving the data. Because it can easily be generated by school using Illuminate’s built-in functionality, change ideas implemented by different sites can be evaluated to determine whether or not they were effective.
Our Strategy and Continuous Improvement team has created numerous BI tool reports, but this was the first I created. Franck Reyherme’s support was tremendously helpful. I have used a variety of data management systems and their embedded reporting tools. Without a doubt, I can say that BI Tool is the most powerful education-specific reporting tool that I have come across in the educational sphere.
The process did have some challenges and ongoing quality control with subject matter experts with our Student Services team was invaluable. As our district does not import behavior data into Illuminate via a nightly script, we chose to use Illuminate’s Summary Assessment as the foundation for the report. The absence of the nightly script requires us to export the data out of our student information system weekly and import it into Illuminate. We then use a custom report to combine this data with our student data. Because the summary assessment could have more than one row for a student, if a student had multiple behavior issues within a time period, we use Illuminate’s custom report grouping feature to help consolidate student records. Also, we use custom filters in the report to ensure that all currently enrolled students are included (not just those with a behavior incident). Illuminate’s BI support team was very helpful in getting these to work for us.
The reality is that the data is only meaningful if content experts can take action to impact student results. We are finding that content experts are starting to use these reports to inform their practice.
*****
Illuminate Education is a provider of educational technology and services offering innovative data, assessment and student information solutions. Serving K-12 schools, our cloud-based software and services currently assist more than 1,600 school districts in promoting student achievement and success.
Ready to discover your one-stop shop for your district’s educational needs? Let’s talk.
