

 Illuminate Blog
BI Tool: MAP Low Level Analysis Report
Last month, Brittany Dimick at Salt Lake City Schools highlighted her popular “CAR” BI Tool Report (Cumulative Assessment Report) that provides an easy and convenient way to access all the assessment data for any particular student. The report pulls in local interim assessments, state assessments, and national assessments (such as DIBELS and SRI), and displays all the data in a simple, easy-to-read report that is perfect for meetings. Brittany’s CAR Report highlights the power of using the BI Tool with SQL, and also demonstrates the power of a simple, minimalistic report design. In case you missed it, you can read all about the CAR Report here.
This month, Brian Schum from Lammersville Unified School District highlights his “MAP Low Level Analysis Report” that combines the BI Tool’s power to visualize & summarize data with a beautifully color-coded student list. The report is a great example of how to use colors and conditional styling to make data much easier to digest. Brian also uses tabs in his report to make all his related reports just one click-away for the end user. Brian’s work with the BI Tool allows educators at Lammersville Unified to spend less time fiddling with data and more time providing targeted intervention to students.
Unlike the “CAR” Report, the “MAP Low Level Analysis Report” did not require any SQL whatsoever. It’s a great example of the type of report anybody can create with the BI Tool with a little training and a growth mindset.
Important BI Tool Enhancement: Exciting News! A couple weeks ago, Illuminate released a new method for adding drill down to your BI Tool Reports. The new functionality makes it dramatically easier for BI Tool users to add drill down to their reports. Read about it here.
Please join Illuminate’s BI Tool User Community by following this link! (To participate in the forum, login to Illuminate, click your Control Panel, select “Illuminate Help Center,” and click on “Community.”)
If you are interested in contributing to the BI Tool Blog, please email me at: freyherme@illuminateed.net
Sincerely,
Franck Reyherme
Director of Business Intelligence Services
*****
MAP Low Level Analysis Report
By: Brian Schum
I am part of a team of 5 instructional coordinators at Lammersville Unified School District in Mountain House, California. My primary responsibilities are coaching 9th-12th grade teachers and all things Illuminate. On any given day, I spend about 50% of my time in Illuminate with the BI Tool building reports and progress monitoring tools. The best part about my position is that I get to work hands-on with the people who are using the reports. On a typical day, I may be working one-on-one with a teacher, leading a data discussion in a department collaboration, or interpreting data with a principal.
I am new to the BI Tool and had not used it prior to attending the 2-day workshop in Irvine this past September. Initially, I was very intimidated by it, but devoted quite a bit of time building and learning as I went. Each report offers unique challenges, and I love the creative and investigative aspects that go into building tools that people can use to improve learning.
The MAP Low Level Analysis Report shows how students who scored in the bottom 40th percentile range scored on each of the subcategories of the most recent MAP assessment. Students at LUSD take the MAP test three times a year as a way of measuring growth in Reading and Math. The winter administration is an indicator of how students will score on the state assessments at the end of the year so it is a good time to do some analysis, especially of those students who are on the bubble and may be able to move up with targeted intervention.

The report came about as the result of going back into the MAP data and playing around with it to figure out if we could dive deeper into the results to pinpoint any trends or specific weak areas. I initially created the MAP Breakdown Report to look at all students but on a whim I filtered the custom report to show only those students at the 40th percentile and below. The results were interesting and I copied it as the MAP Low Level Analysis Report to pinpoint areas of struggle. A student detail band was also added so that teachers could better plan interventions.
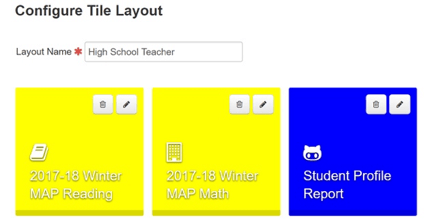
Experience as both a classroom teacher and administrator has taught me that any data has to be easily accessible and immediately applicable to classroom practice if it is going to be used. To facilitate ease of use I built “tabs” into the report so that once a user is in the report they can click between different related reports without having to exit it. The reports were also added to a custom tile layout to further facilitate ease of navigation.
Illuminate provides excellent reports for NWEA/MAP but none of them were able to provide this specific view. While it is not the most technically proficient report, it has been widely used and is a great example of how the BI Tool can extend what is already available.
*****
Illuminate Education is a provider of educational technology and services offering innovative data, assessment and student information solutions. Serving K-12 schools, our cloud-based software and services currently assist more than 1,600 school districts in promoting student achievement and success.
Ready to discover your one-stop shop for your district’s educational needs? Let’s talk.

How can we get this neat report published to our district Illuminate for utilization? Looks really useful! ^__^
Hi Chris,
I’ll ask Bryan if he’s willing to share the jrxml files, and if so, I’ll send them over to you.
You will have to make an identical custom report in your Illuminate site, and make several adjustments to the report(s) to make them work in your site. That said, the adjustments should be relatively minor.
Thanks Franck! 🙂 Loving the blog.