

 Illuminate Blog
How to Track Progress & Growth with an Accountability Dashboard
Why did we build an Accountability Dashboard?
Despite what you’ve heard in the news, ESSA is still around. Even our U.S. Secretary of Education, Betsy DeVos, is saying that we should honor the timeline that was already set in place. So, we’re going to keep moving forward, and all the individual states are still moving forward with their own state accountability plans.
The good news is that, as a country and as a state, we have reframed what accountability means. In the past, people avoided the word because it had such a negative connotation with compliance and punitive actions. Now, accountability gets to serve as a means to deliver on the promise of equity and highlight our efforts to ensure that ALL students, not just some, are successful on their path to College or Career.

Figure 1
The 5 x 5 grid you see (Figure 1) is one example of how California has flipped the script by using student performance measures that reflect growth (in addition to a snapshot of performance) in our accountability model for districts and charters. Figure 1 is an example of one of the eight state indicators used in the model.
In California and across the country, schools are being encouraged to use multiple measures of student success and progress instead of a single state test score. In Figure 1 above, you’re looking at a rubric for the English Learner Indicator (ELI). On the left-hand side of the grid, you’re seeing English Learner Status, which is measured by student performance on demonstrating English proficiency (currently measured by the annual CELDT) and reclassification rate. At the top of the grid, we’re looking at the change in that status from year-to-year. In other words, what percentage of students are making progress in their English acquisition and being reclassified, and how does this performance compare to last year?
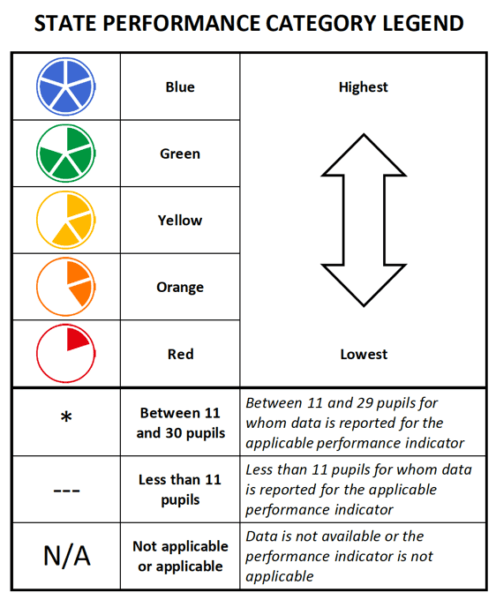
Figure 2
The image above (Figure 2) shows how the rubrics (5 x 5 grids) are used to display information on the California School Dashboard. California educators and the public will see pie chart graphics per indicator that represent the 5 x 5 grid mentioned above. The pie charts will display the status and change performance on various indicators disaggregated by student groups containing 30 or more students.
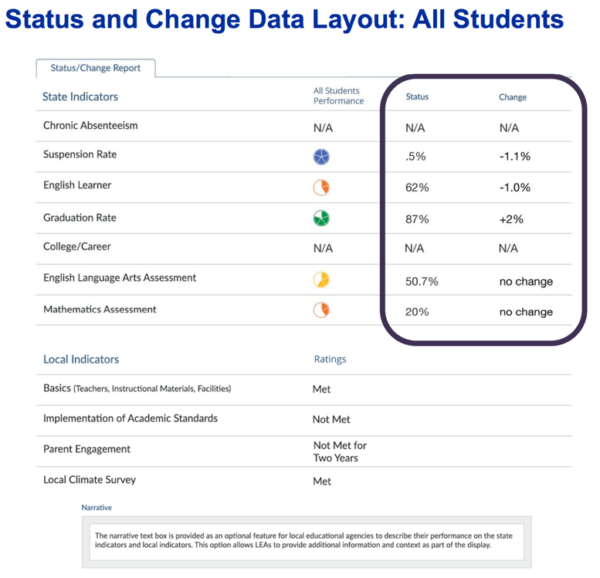
Figure 3
This is one tab from the California School Dashboard called the “Status and Change” Report (Figure 3). Eventually, there will be four reports accessible from the dashboard, but for the Spring 2017 release, we should be able to access the Equity and Status & Change Reports. For now, the State Indicator section of the report will be populated by the state based on data primarily from the 2015-2016 academic year.
You’ll notice “Chronic Absenteeism” and “College/Career” are two indicators that California doesn’t have data for yet for the 2016-2017 academic year (those two indicators appear as N/A until Fall 2017). The Local Indicators section of the report will default to display N/A for this academic year (unless districts and charters elect to complete these sections), but moving forward will also provide additional insights about our schools.
These sample reports give us a sense of the more comprehensive nature of the indicators that California is currently leveraging for our accountability model. It’s encouraging to see a more complete profile of our schools and ALL the students being served. The new dashboard can serve as a starting point for many conversations about what we need and expect from our students, educators, schools and communities.
What does this all mean?
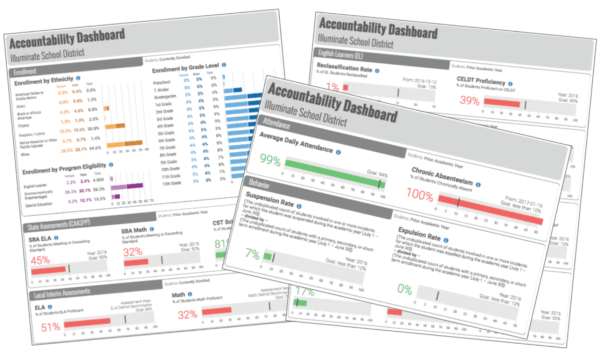
Illuminate has also recently released an Accountability Dashboard report to coincide with the state’s release. This tool, among others, is meant to be used to progress-monitor and provide feedback to stakeholders to take action. Illuminate’s Dashboard provides live access to the most recent data for current students for the 2016-2017 school year so that efforts attempted during this academic year could be analyzed now. The benefit of having access to our dashboard and the multitude of reports that follow, is that the data is real-time and provides districts with the tools they need to make adjustments to impact students now. The state dashboard can be used as a tool to evaluate and confirm the work that has already been done.
Our dashboard is definitely not the end-all, be-all though. In fact, it’s only the beginning—the starting point. Having access to data, the reports, and the dashboard is the entry point to more questions and an inquiry process that leads to better outcomes for students and staff. Additional reports and data that may supplement this work include:
- Multiple Assessment Performance Report (or CA version) – To identify gaps in student performance across multiple measures to dig deeper into why and close them.
- Longitudinal CELDT – To identify Long Term English Learners (LTELs), establish goals for improved performance, and communicate the steps required for reclassification.
- Custom Reports & Quick Guide – To analyze demographic data with other metrics to find patterns, identify strengths or opportunities, and scale best practices.
Hopefully, your districts are discussing ways to support learning for every student and your staff is empowered to collaborate with resources and methodologies to implement accountability at all levels of the system. Let us know how we can continue to make the system useful for you!
Illuminate Education is a provider of educational technology and services offering innovative data, assessment and student information solutions. Serving K-12 schools, our cloud-based software and services currently assist more than 1,600 school districts in promoting student achievement and success.
Ready to discover your one-stop shop for your district’s educational needs? Let’s talk.

This is a very informative article that gives pertinent reasoning to equity discussions.
Are you able to create an accountability dashboard for Texas schools?
Thank you for your time,