

 Illuminate Blog
FastBridge Progress Monitoring: A Primer
Written By: Rachel Brown, Ph.D., NCSP, Theodore J. Christ, Ph.D., Jessie Kember, Ph.D., and Nicole M. McKevett, MA, NCSP
Progress monitoring is defined as the frequent assessment of students who are participating in supplemental intervention. It can inform whether the addition of the intervention is helping the student to achieve the intervention goal.
Progress monitoring is available with multiple FastBridge assessments in reading, math, and social-emotional behavior.
You can determine the best progress monitoring measure for each student based on scores from the screening measures that you administer.
Several tools within the FastBridge system can help you determine the recommended progress monitoring measure.
Table of Contents
- Setting Up FastBridge Progress Monitoring
- Understanding FastBridge Progress Monitoring Data
- Reorganizing FastBridge Progress Monitoring Groups
- FastBridge Progress Monitoring: Tools Teachers Need
Setting Up FastBridge Progress Monitoring
FastBridge has three different pathways for setting up progress monitoring schedules:
- Let the system set up progress monitoring
- Have the system tell you what to do; or
- Do it yourself
These options are designed to support teachers as they become more familiar and comfortable with FastBridge and how progress monitoring works to improve student outcomes.
Let FastBridge Do It for Me
This is the fastest and easiest way to set up progress monitoring in FastBridge. In order to use this option, certain specific FastBridge options and features must be activated and used including the FASTtrack Reading and/or FASTtrack Math tools as well as the Screening to Intervention Report.
FASTtrack Reading and FASTtrack Math are organizational tools that pull together links for all of the assessments that a teacher might need to use with his or her current students.
Once activated, teachers will be able to screen their students with successively more specific assessments in order to identify intervention and progress monitoring needs.
A key feature of FASTtrack Reading and FASTtrack Math is an easy pathway for using two complementary assessments with students so that the best instruction or intervention can be quickly identified.
For example, the FASTtrack Reading screen has links for screening students with both earlyReading and CBMreading. Together, these two reading assessments provide detailed information about what instruction each student needs.
The benefit of using these fast tracks to conduct screenings is that these tools will enter the students’ scores into the Screening to Intervention Report. This report provides precise intervention recommendations for individual students. Here is an example of a Screening to Intervention Report:
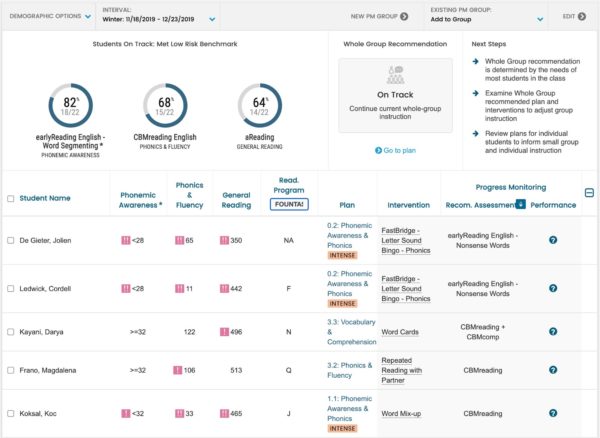
Through a combination of earlyReading and CBMreading data, this report indicates if the student needs instruction in reading accuracy, automaticity, or broad reading. It also suggests what tier of instruction matches each student’s data, what progress monitoring to use, and what existing progress monitoring groups the student could join.
Have FastBridge Tell Me What to Do
A second option for setting up progress monitoring is to have FastBridge walk the teacher through the progress monitoring steps but let the teacher do the actual setup. The starting point for this method is to review the suggested progress monitoring tools for each grade and skill area.
These recommendations for progress monitoring are based on research about what assessments most accurately reflect a student’s learning growth over time. Below are the recommended measures for reading and math:
| Grade | Reading | Math | ||
| Measure | Weekly Goal | Measure | Weekly Goal | |
| K | Letter Sounds | 3 | Numeral ID | 1.25 |
| 1-2 | CBM Reading | 1.5 | CBMmath: Automaticity
Process Concepts & Applications (CAP) |
.6
NA* .1 |
*CBMmath Process is skill specific so does not have one default weekly goal.
In addition to knowing which measure to use, it is important to know how much a student should be expected to improve each week and what the end of year (EOY) goal is. The above table shows the recommended (default) weekly goals for each of the suggested progress monitoring tools in reading and math.
Note that the above weekly goals are considered realistic for any student who is behind and needs to catch up to peers. However, for students who are significantly behind, higher weekly goals are needed in order for them to make catch-up growth.
The above suggestions are general and might not apply to all students. It is important to make sure that the progress assessment measures the exact skill being taught. In general, there are two types of progress measures:
- General outcome measures (GOM)
- Single skill measures (SSM)
In addition to knowing the measures and goals, teachers will need to know the steps to set up a progress monitoring schedule. These details are in the following section about how to set up progress monitoring on your own, without guidance from the FAST™ system.
I Will Do It Myself
All FastBridge users always have the option to set up a student’s progress monitoring schedule on their own and without specific system supports. In order to do this, the teacher will need to know what progress monitoring is best and what an appropriate goal is.
To initiate a progress monitoring schedule, click on the Progress Monitoring menu on the left side of the FastBridge screen. This will open that menu and you will then click on Create progress monitoring Group. This will open a new screen where you will select the student(s).
Note that you can add more than one student to a progress monitoring group at a time. In the progress monitoring setup screen, you will enter the details about the group, including the measure, frequency, weekly goal amount, and intervention details.
The intervention details will appear on the progress report only if they are entered in the progress monitoring schedule.
Setting Up FastBridge Progress Monitoring Groups
- From your home page, click on the Progress Monitoring tab.
- In the left navigation pane, click on “+ New progress monitoring Group.”
- Click on students in the lower part of the screen and their names will be automatically moved to the “Selected Students” section.
- Classroom teachers will see all students in their class.
- Teachers with grade-wide access will see the whole grade.
- Specialists will see all of the students in the selected school.
- Click on either New progress monitoring Group for an academic measure or Behavior progress monitoring for a behavior measure. Once some groups have been created, you can also select “Add to group…”
- A new screen will open where you will enter the details of your new progress monitoring group, including:
- Starting week (all dates will be Sundays of the starting week.)
- Ending in school year
- Select this year unless you need the data to carry over into the summer or to the next school year.
- If the student will be monitored in the summer, select that button.
- Assessment type:
- For academics, select either reading or math and the available options for the grade level will appear.
- For behavior, select up to 3 behaviors in each skill area.
- Create a name for your progress monitoring group.
- It is recommended to develop a school- or district-wide strategy for naming your groups, so they make sense to all users in the system.
- Select the number of occasions you want to administer the measure a week.
- For academics, weekly monitoring is recommended.
- For behavior, daily monitoring is recommended.
- Note that the frequency cannot be changed after any progress data have been collected.
- For CBMreading, the grade level of the measure can be adjusted in the column named “Level.” Note that this cannot be changed later.
Administration of FastBridge Progress Monitoring
Once the progress monitoring group is created, the next step is to administer the progress monitoring measure on a regular basis. To access the progress assessments:
- Select the Progress Monitoring tab.
- Click on “View progress monitoring Group.”
- Select your group from the list of progress monitoring groups.
- Click on the timer icon in the row and column for the student and date that you are administering the progress monitoring measure.
- Administer the assessment following the standardized directions.
Progress monitoring graphs are automatically created in the FastBridge system. The dots on the graphs are the student’s scores, the dashed line is the goal over time, and the solid line is the trend line. To view a progress monitoring graph for your student(s):
- Select Reporting from the main navigation menu.
- Under “Intervention & Monitoring,” click on “Progress Monitoring Report.”
- Select the assessment the student is using.
- Choose the progress monitoring group.

Understanding FastBridge Progress Monitoring Data
One key skill needed to use the FastBridge progress monitoring assessments is how to understand the data. The important components of understanding progress monitoring data are to know:
- How many data points are needed
- How often to look at data
- What information is on the progress graph
- How to understand the graph
The primary document that is used to evaluate student progress is the FastBridge Progress Monitoring report.
How Many Data Points Are Needed?
Although it’s possible to begin to review data with as few as three data points, most of the time three scores are not enough for the information to be reliable. Research indicates that it usually takes about 10 data points for GOM and six data points for an SSM for a series to be reliable and interpretable.
Keep in mind that it is normal for student scores to vary from week to week, and such scores rarely go in a straight line. Nonetheless, the more variable the scores, the more data points are needed to ensure that the scores are reliable.
How Often to Look at Data
In order for progress monitoring data to be useful, it must be reviewed. FastBridge recommends that teachers review student progress data every six weeks. With FastBridge’s FAST Projection™ line, six data points is enough information for the system to predict if the student will meet their targeted goals.
Much of the time, no changes will be made to an intervention each time the data are reviewed. Nonetheless, it is important to look at the data regularly so that changes to interventions can happen as soon as the data indicate the necessity.
In other words, regular review ensures that teachers know which students are making effective progress and which ones need other assistance.
What Information Is on the Graph?
An example of a progress monitoring graph is shown below:
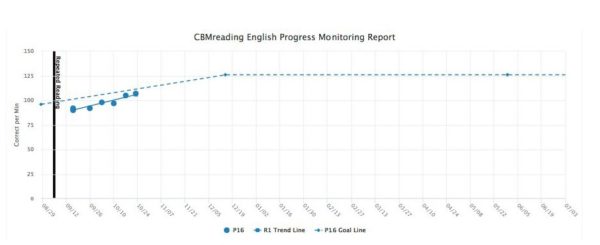
All progress monitoring graphs are set up so that the student’s score on the measure is along the Y (vertical) axis and the dates when monitoring happened are on the X (horizontal axis). Each data point represents one administration of the measure.
The data points start out in blue, but if a student changes groups, will display in other colors. There will be a dashed line that is the student’s goal and a solid line that shows the trend of the student’s data over time.
If the intervention details have been entered into the FastBridge system, the name of the intervention will appear along a vertical line indicating the start of the intervention.
How to Understand the Graph
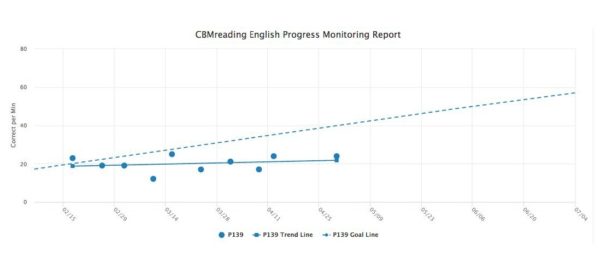
By looking at this graph, we can see that the trend of the student’s data (solid blue line) is well below the goal line and not improving. There are 10 data points and there is limited variability in the scores.
A graph like this one indicates that something needs to change in order for the student to make gains. Even with fewer than 10 data points, this graph suggests that the student needs help. As a rule, if a student has three or more data points below a goal line, a change should be considered.
Before changing the intervention, it is important to consider if other factors could explain why the student is not making progress. These factors include:
- Has the intervention been implemented correctly? (i.e., integrity)
- Is the frequency and duration of the intervention adequate? (i.e., dosage)
- Is the intervention addressing the right skills?
- Is the goal too ambitious?
With answers to the above, the appropriate change in the student’s instruction can be made.
When an intervention has not been implemented correctly, then resources should be devoted to accurate use. If the frequency or duration is not enough, these should be increased. If the intervention is addressing the wrong skills, a change in the focus should be made. A change to the goal should happen only if the above changes do not work.
Whenever a change is made in the intervention, this should be noted in the progress monitoring schedule so that it will show on the graph and report. Such information is very important for the student’s future teachers who will want to know what steps were taken to assist the student.
Importantly, the FastBridge progress monitoring tools are designed so that students should not need to switch groups very often. Instead, the changes to intervention should be noted in the record.
Reorganizing FastBridge Progress Monitoring Groups
The purpose of progress monitoring is to determine whether this additional instruction is improving student performance toward a specific learning goal, whether related to:
- Reading
- Math
- Social-emotional behavior or
- Another school-relevant domain
Progress monitoring allows for quick and frequent assessment of a student’s academic performance, measurement of that student’s rate of improvement, and evaluation of the student’s rate of improvement to determine the effectiveness of instruction or intervention. When organizing this information, it is often most effective to work in groups.
Creating Progress Monitoring Groups
When reviewing student screening data to identify which students need additional instruction and intervention, the FastBridge system uses two primary symbols to indicate which students might be at risk for not meeting end-of-year benchmark goals:
- ! some risk
- !! high risk
Using these symbols, along with other sources of data and information, can assist school teams in creating and organizing groups of students with similar skill sets and similar levels of performance.
More specifically, those students at some risk (!) are closer to meeting the benchmark goal and can oftentimes meet the end-of-year benchmark goal with a less intensive intervention. Those students at high risk (!!) may need more intensive intervention.
These symbols are one piece of information that provides educators with support in determining the intensity and content of instruction and intervention tailored to each progress monitoring group that is created.
Modifying Progress Monitoring Groups
Once progress monitoring groups have been created, it is important to determine: are these groups working? Or do adjustments need to be made?
After creating progress monitoring groups, it is important to examine the performance of these groups, as well as the performance of individual students in each group, to determine whether to …
- Continue
- Discontinue; or
- Modify
… the intervention.
Just as decisions are made regarding the intervention delivery, decisions also need to be made regarding organization of students into intervention groups. While it is important to determine whether growth is occurring in your progress monitoring groups, it is also important to consider whether adjustments can be made in order for greater gains to be made.
Each progress monitoring group is characterized by the instruction that they receive. Students in each progress monitoring group, although they started the intervention at similar levels of performance, may have different rates of improvement when provided with the same intervention and support.
In other words, the instruction and intervention may be working for some students, while other students may show less growth. This is a scenario in which progress monitoring groups can be reorganized to better benefit the students receiving instruction and intervention.
A student showing a large rate of improvement while receiving intervention could need to be moved from one progress monitoring group and re-assigned to another. Similarly, a student showing a smaller rate of improvement may also need to be reassigned to benefit both the progress monitoring group and the individual student within each progress monitoring group.
It is important to remember that once students are organized into progress monitoring groups, this assignment is not permanent. Progress monitoring and intervention groups can and should be reorganized as students make progress at different rates.
These decisions should be informed by multiple sources of information, including:
- Stability of scores
- Level of scores
- Accuracy
- Trend over time
When to Consider Reorganizing Progress Monitoring Groups
As mentioned previously, there may be instances when it is appropriate for intervention or progress monitoring groups to be modified. Before reorganizing groups, it is important to collect enough data to make a decision regarding whether the intervention is effective for a particular student, and subsequently, whether the students are organized appropriately.
An important step in reviewing student data and considering new groups is whether there are sufficient data points to make decisions regarding instruction or intervention.
Research suggests that it is important to have at least nine (i.e., nine weeks of intervention data) to twelve data points before making any changes to existing interventions and progress monitoring groups.
Making changes to instruction too soon will make it difficult to determine whether a particular intervention (or the organization of the group) is effectively targeting the student’s needs. Regardless of the criteria used, it is important to select a decision-making rule and to consistently use this rule.
For example, when collecting data through progress monitoring, if a student’s most recent data points are all below the goal line, this may be an indication that a change needs to be made in the instruction/intervention being delivered.
If all data points fall above the goal line, perhaps the goal line should be increased.
Finally, if some points fall above the goal line, and some fall below, this may be a scenario for which you continue with instruction/intervention, and placement of students in groups will remain the same.
It is important to review intervention data on a regular basis. For example, it is recommended that data be reviewed at least monthly to make informed decisions regarding intervention content and group organization.
Reorganizing Progress Monitoring Groups
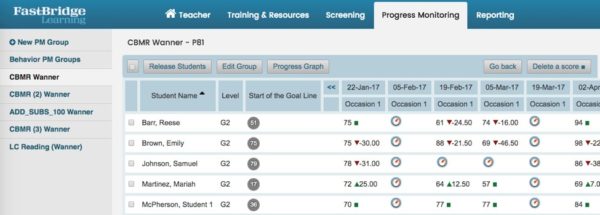
From the Progress Monitoring navigation tab, users can access their academic and behavior progress monitoring groups. Current progress monitoring groups will display on the left vertical menu. Click on one of the group names to view the students in the group. Here is an example:
To reorganize the group you can click on either Release Students or Edit Group. The Release Students button will remove a student from the group. To do this, click on the button to the left of the student’s name and then click on Release Students. Once a student is released, he or she can be assigned to a new progress monitoring group.
If changes are needed in relation to the interventions or goals for students in the current group, click on Edit Group. This will open the progress monitoring setup screen and the details for all or selected students can be changed.
For example, specific interventions or student goals can be adjusted. To make such changes, click on the specific item in the student’s schedule. Here is an example:

Notice that Emily Brown is participating in a different intervention than the other students in the group. Also, notice that all of the students have different goals. Students in a progress monitoring group can have different interventions and goals, but must all be monitored with the same progress measure.
FastBridge Progress Monitoring: Tools Teachers Need
The FastBridge’s progress monitoring tools are designed to help teachers create and use data to monitor student progress. The system has features that will identify the right:
- Intervention
- Progress measure; and
- Group
Teachers can also use FastBridge to identify possible measures and select one themselves or to set up progress monitoring schedules on their own.
In order to help students who are behind catch up, teachers can set realistic goals and implement interventions carefully to help the student beat the odds.
References
Thornblad, S.C., & Christ, T.J. (2014). Curriculum-based measurement of reading: Is 6 weeks of daily progress monitoring enough? School Psychology Review, 19-29.
