

December 14, 2017
Back in the days of No Child Left Behind (NCLB), schools were given credit for the percentage of students achieving the state’s “proficient” level. The amount of ground that students needed to cover in order to reach proficiency was not part of the equation, however.
In the past few years, accountability has expanded the view of achievement by recognizing that some students have to travel a much greater distance (metaphorically speaking) to reach proficiency, even though this remains the minimum target for everyone. This has led policymakers to look at ways to measure students’ academic growth via various growth models.
It’s clearly impossible to get a picture of the whole child without measuring academic growth. In this blog, I’ll break down what student growth really is and discuss some of its components. I’ll then describe six models that schools are using to measure student growth.

What does student growth mean?
To put it simply, student growth is how much academic progress a student has made between two points in time. For example, this could be from the start of the school year to the end of the school year, or from one grade to the next.
But measuring the academic growth of students is not a simple matter. There are many different approaches and models that exist, with each one having its own implementation procedures and use cases. No matter how you measure growth, all methods of measuring growth depend on several factors to be valid and reliable.
First, you need to have good assessments featuring quality items with sound psychometric properties. This includes the number of items, standards alignment, DOK levels, P-Values, and so forth.
Additionally, there needs to be alignment among the assessment, the curriculum, and the methods of instruction. Students need to be motivated and engaged to do their best, so we have some idea of the reliability of the growth data that is being provided to us through the assessments.
Why it’s important to measure student growth
Measuring student growth is important because it leads to a better picture of the whole child. Instead of just looking at grades on a test or report card, we are able to see how much knowledge students have gained over a given period of time, which helps us to better evaluate their progress. In other words, student growth data gives a more comprehensive understanding of learning and a better indication of progress than a one-time test does.
Growth measures are also valuable because they can give local and state leaders a more complete picture of a school and the overall quality of instruction.
Student growth measures give teachers a way to evaluate themselves as well. When educators compare where their students were at an earlier point in time academically with where they are now, they can better evaluate the impact of their teaching and make adjustments as necessary.

Student growth measures examples
The ways we measure student growth can be divided into summative and formative uses of assessment.
Summative assessments are cumulative and often show what students have learned at the end of a topic of study or general course. Examples of summative assessments include:
- Unit tests
- Midterm or final exams
- Papers
- Final projects
- District or state tests
In contrast, formative assessments involve feedback that continuously measures what students are learning. Because they reveal whether and how students are growing day-to-day, formative assessments should be used to make decisions about what lessons come next. Examples of formative assessments include:
- Classroom quizzes
- Written comments on student work
- Casual conversations
- Informal surveys
- Rubrics
- Discussions during and after a lesson

Models of measuring student growth
There are six different methodologies and approaches we can take when it comes to measuring the growth of students. These models are more likely to use summative assessments to provide academic growth data. Let’s explore each model in more detail.
Accurate insights on student growth
Discover assessment tools from Renaissance to measure academic growth.
#1: Gain score model
The gain score model measures year-to-year change by subtracting the prior year’s (initial) score from the current year’s (final) score. The gains for a teacher are averaged and compared to the overall average gain for other teachers. Gains are quite easy to compute and can be used with local assessments.
We’ve had state accountability assessments use the gain-score model as well, and it’s probably the most basic model available. The problem is that it doesn’t account for students’ initial achievement levels. Instead, it’s just a basic calculation of the change in score for students.
#2: Value-added model (VAM)
A value-added model (VAM) is frequently used for teacher evaluation because it seeks to measure the teacher’s contribution in a given year by comparing the current test scores of their students to the scores of the same students in previous years. In this manner, value-added modeling seeks to isolate the contribution that each teacher provides in a given school year, which can be compared to the performance measures of other teachers.
VAMs are considered to be fairer than the gain score model, given that a VAM considers potentially confounding context variables like past performance, student status, or socioeconomic status (SES).
VAMs are generally not used with local assessments but are intended for state accountability assessments. Typically, the calculations of these models are complex, and you’ll need quite a bit of data for the VAM calculations to occur.
#3: VAM-covariate adjusted approach
In this model, growth is measured by comparing students’ expected scores with their actual observed scores on an assessment.
How does this work?
A student’s expected (or predicted) score is obtained by looking at prior test scores over multiple years—as well as students with similar testing performance in those prior years and other similar characteristics. An estimate is then made of how this group of students would be expected to score (on average) on a test:
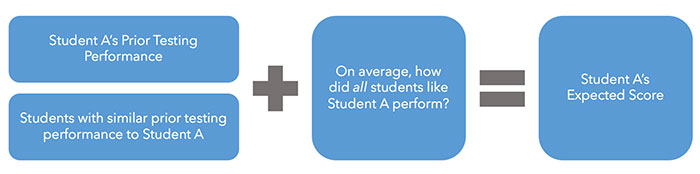
The growth measure is related to the number of scale score points a group of students scored above or below their expected score, which takes into account their prior testing performance.
One of the downsides of this approach is that it requires several years of “matched” data for accuracy. In other words, you can’t just use any random group of students for prior testing performance—you need to have that data linked to all the same students over several years to have an accurate VAM model.
#4: Student growth percentile (SGP)
A student growth percentile (SGP) describes a student’s growth compared to other students with similar prior test scores—known as “academic peers”. Percentiles are used to rank a student’s growth compared to their peers, which is more a straightforward and easier-to-interpret method.
Student growth percentiles also allow us to fairly compare students who start at different levels with similar students. This is called “banded growth.” This model can be used with local assessments, such as a pre-test or post-test model.
Unlike VAMs, each student receives an individual percentile score, ranging from 1–99. A student with an SGP of 60, for example, grew as much as or more than 60 percent of their academic peers during the same time period.
Note that both FastBridge and Star Assessments from Renaissance report student growth percentiles.

#5: Effect size approach
Effect size is a way of quantifying the size of the difference between two groups that is easy to calculate and understand, and can be used with any outcome in education (or even in fields like medicine).
The goal of effect size is to provide a measure of the “size of the effect” or impact from instruction rather than pure statistical significance, which gets confounded with effect size and sample size.
Effect size scores are equal to “Z-scores” of a normal distribution and have the same possible range of scores. Effect size scores will typically range from -1.5 to +1.5. If a teacher receives an effect size of +1.0, for example, this means that their students grew 1 standard deviation of test score points more than the average teacher’s students.
#6: Computer-adaptive approaches
These have become quite common and typically use a “Vertical Scaled Score” to show growth in a single year on the same scale. This method is ungraded and could be similar to measuring a student’s height—as a student grows on the vertical scale, they are increasing their academic skills accordingly.
They can also overcome the limitations of fixed-form assessments (i.e., a subset of items that can’t be adjusted). In other words, adaptive assessments will adapt downward or upward in difficulty, based on a student’s performance.

How Renaissance can help teachers measure student growth
To sum up, focusing on student proficiency by itself is not enough. Schools and districts are required to show student growth within and across school years as well.
Renaissance’s FastBridge and Star Assessments provide valid and reliable data for universal screening, progress monitoring, measuring student growth, and much more.
Highly rated by the National Center on Intensive Intervention (NCII)—the leading third-party evaluator of K–12 assessments—FastBridge and Star provide quality data to support effective instruction and intervention.
Learn more
Connect with an expert today to learn more about FastBridge, Star Assessments, or other Renaissance solutions for today’s classrooms.