

 Illuminate Blog
BI Tool: Student Growth Percentile Scatterplots
Welcome to Illuminate’s BI Tool Blog! Over the last 2–3 years, the number of districts using Illuminate’s Business Intelligence Tool (BI Tool) has exploded. Over 3,000 BI Tool reports have been created by over 250 school districts, with more being created every day. At Illuminate, we pride ourselves at putting powerful technology directly in the hands of educators. To that end, our developers have worked tirelessly over the last few years to make the BI Tool more and more accessible to educators, but there is still much work to be done.
Illuminate envisions a robust BI Tool Community where Illuminate BI Tool Users across the country can contribute ideas, share best practices, and collaborate on their data visualizations. Recently, we launched a BI Tool User Forum, providing a space for BI Tool Users to communicate with each other. Follow this link to view the BI Tool User Community forum. (To join the forum, login to Illuminate, click your Control Panel, and select “Illuminate Help Center.” Let me know if you have any trouble logging in!)
As part of the BI Tool Community, we are starting a monthly BI Tool Blog where, each month, a BI Tool user will be selected to highlight one of their favorite BI Tool reports and share a few tips/tricks they learned along the way. For our first ever BI Tool Blog post, Shiawassee RESD has graciously volunteered to highlight one of their favorite BI Tool reports. (See below!)
If you are interested in contributing to the BI Tool Blog, please email me at: reyherme@illuminateed.net
Sincerely,
Franck Reyherme
BI Tool Specialist
*****
Student Growth Percentile Scatterplots
By: Diane Wascher, Justin Knull, and Haley Newman at Shiawassee RESD
To introduce our article, we thought we’d begin by introducing ourselves. We are a group of three (a Data Specialist, a Database Specialist, and an Instructional Technology Specialist) who work as a data team at the Shiawassee Regional Education Service District, an Intermediate School District, in Michigan. We are a county level organization that sits between the State Department and our local Districts to provide educational services. We service around 11,500 students in our eight local districts. We have been Illuminate DnA customers since 2011 as a countywide, consortium build, and we attended our first BITool training in May of 2016. Since then, our data team has worked very closely, creating numerous reports as we continually hone our skills with consistent follow-up support from Franck. The report we’d like to share is one of our more recent reports that we are particularly proud of.

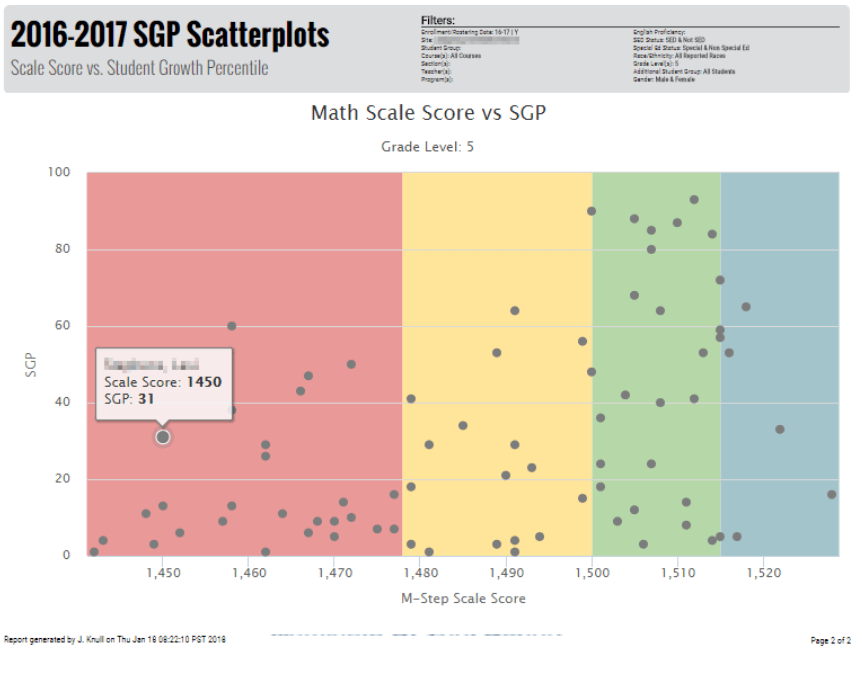
Beginning in 2015, students taking Michigan’s State Assessment began receiving a Student Growth Percentile score along with their Scale Score and Proficiency Rating. This SGP judged students’ growth compared to peers with the same scale score on the previous year’s assessment. These SGP scores are, in theory, independent of a student’s scale score, however the two points of data should be viewed together in order to give some context to the numbers. For example, a student just shy of proficient with a high SGP is quite different from a student just shy of proficient with a low SGP.
In 2016, in order for our schools to view the relationship between their students’ scale scores and growth percentiles, our organization was provided with a super complicated Excel template into which one needed to copy and paste the entire student data file from our state assessment. The Excel template then used its built in formulas to produce Scatterplots of Scale Score vs. SGP for each grade level and content area. The resulting graphs were then printed and distributed to District and School leaders at their respective admin meetings to begin discussions about these data.

Immediately, as these paper graphs were being distributed, questions began to arise. “Why is the y-axis where it is?” “How do I know which student this dot represents?” “What is the actual score/SGP represented by this point?” And so on, clearly indicating that the amount of work involved to create these charts for each of our Districts was not doing the job of answering our schools’ questions and generating the right discussion.
The following year, as our state assessment data started coming in, we began to hear the grumbling of those who were tasked with creating these charts, and confidently said, “We’ve got this.” The result has become one of our team’s favorite reports, specifically because we were able to use JasperSoft to significantly improve an existing tool to make it easier to use, more accurate, and more visually appealing.
After some work by our team, we were able to recreate this Excel Template as a live, Prebuilt report in Illuminate. We no longer had to create separate files for each District/School, Illuminate’s visibility does this already; and, we no longer needed to distribute paper copies to our administrators.
One big challenge in creating this report was to create a single report rather than separate reports for each grade level and content area. As a result, almost every element of this report displays based on a grade level being chosen from the filters, from the proficiency color bands to entire pages. Because the report wouldn’t run without a grade level being selected, we decided to provide a friendly reminder to our users through the No Data band in Jasper, just in case they forget.

In addition to being far less work for our staff, our report provides answers to all of the questions that arose from the Excel charts through the use of the tooltip to display student names and scores, and it includes live data. Plus, we think it looks far more clean and polished.
*****
Illuminate Education is a provider of educational technology and services offering innovative data, assessment and student information solutions. Serving K-12 schools, our cloud-based software and services currently assist more than 1,600 school districts in promoting student achievement and success.
Ready to discover your one-stop shop for your district’s educational needs? Let’s talk.
