

 Illuminate Blog
BI Tool: The “Quick Lookup” Report
Last month, in recognition that September was Attendance Awareness Month, Scott Johnston-Roark, Romulus Community Schools’ District Data Coach, shared his “Attendance Update Parent Report” with the Illuminate BI Tool community. The report is beautiful in its simplicity. Most importantly, the report represents a model for (A) getting the right data to the right people at the right time (i.e., parents, before it’s too late) and (B) using data proactively to address important problems and offer actionable solutions. The report is also a great example of Illuminate Data & Assessment clients (DnA) using the power of “Summary Assessments” (e.g., custom data tables) to do attendance reporting in Illuminate.
This month, we asked an ISI (Illuminate Student Information) client, Berkeley Unified, to share one of their favorite BI Tool reports, and like Romulus, the report they chose includes attendance data. The report is called the “Quick Lookup” Report and neatly combines absences, tardies, and grades for any student, broken down by course/period. Jimmy Hoang, student systems analyst at Berkeley Unified School District, calls the report “vital for teachers, counselors and other support staff.” Read all about it below!
Please join Illuminate’s BI Tool User Community to collaborate with Illuminate BI Tool users throughout the country. Simply follow this link and click the “Follow” button at the top. (To participate in the forum, login to Illuminate, click your “Control Panel,” select “Illuminate Help Center,” and click on “Community.”)
If you are interested in contributing to the BI Tool Blog, please email me at: freyherme@illuminateed.net
Sincerely,
Franck Reyherme
Director of Business Intelligence Services
Illuminate Education
*****
The “Quick Lookup” Report
By: Jimmy Hoang, Student Systems Analyst at Berkeley Unified School District
My name is Jimmy Hoang and I am the student systems analyst at Berkeley Unified School District (BUSD). We are a district of about 10,000 students. We switched over from PowerSchool to Illuminate last year and I was in charge of implementation, which included: system setup, data migration and validation. BUSD has a long history of using SQL queries in our SIS—both in PowerSchool and Illuminate ISI.
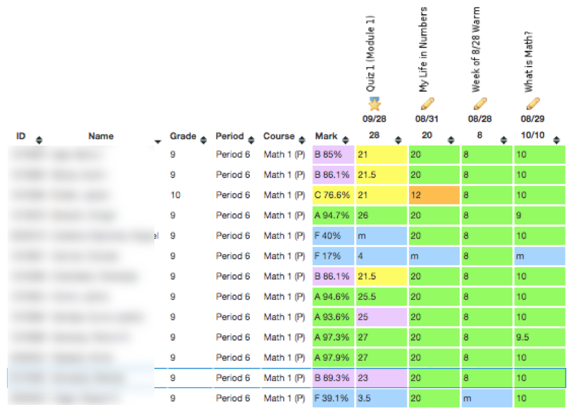
The report I would like to share is called “BHS Quick Lookup ISI.” In PowerSchool, there was a student page called “Quick Lookup,” and users were able to easily look up and retrieve a listing of student grades and attendance records by period displayed on one screen. This screen is vital for teachers, counselors and other support staff to easily look at trends, then determine and provide students with necessary support. Parents had access to this screen in the Parent Portal as well.
Replicating this vital tool in Illuminate was a priority for the district. In order to replicate this lookup tool in Illuminate, I created this report where users can filter by students so they can easily look up a student’s current semester grades and attendance records by period.

The report displays the student’s current classes and teachers’ names, as well as the grades they are receiving. It also shows a breakdown of total absences and tardies for each period by semesters. When users click on the course name, it will open up the course’s gradebook on a new page.
Eventually, I will make improvements to this report to allow users the ability to drill down to get detailed information instead of summarized information. Also, instead of linking the course name to the course’s gradebook which include the grade information for every student in the course, I will link it to that individual student’s grade information.
BHS Quick Lookup ISI is widely used throughout the district, just like the Quick Lookup page was in PowerSchool. The report was well-received and district staff were especially happy to have the ability to easily access student information in our new system.
The challenge in creating this report is using SQL to bring in all the necessary data fields and have the report load efficiently. Initially, it took a while to generate the report for a whole class but after some optimization of the query, it runs much faster.
I designed the report with neutral colors and used brighter colors for grades, and used conditional formatting to highlight grade information that is concerning. This allows users to quickly and easily identify the students who need additional support to succeed.
*****
Illuminate Education is a provider of educational technology and services offering innovative data, assessment and student information solutions. Serving K-12 schools, our cloud-based software and services currently assist more than 1,600 school districts in promoting student achievement and success.
Ready to discover your one-stop shop for your district’s educational needs? Let’s talk.
