

 Illuminate Blog
Data Visualization & Action Plans: Filling Gaps in Seeing the “Big Picture”
Almost every district, charter, or educational organization has a strategic plan. Sometimes, we refer to these as improvement plans or action plans. Strategic plans are partially an accountability piece, but they are also more than that: they help us articulate our goals for supporting students—and the specific, measurable actions we’ll take to achieve those goals. They help us know if we, as a district, are on track.
In my conversations with districts across the nation, I’ve found many educators are facing two big challenges with their action plans.
Monitoring and Taking Action During the Year
First, districts are struggling to monitor their strategic plans in real time throughout the year. Without a simple and visual way to monitor important data, it’s difficult to take action on an action plan.
Douglas Reeves conducted a study that analyzed and scored hundreds of strategic plans and compared them to student outcomes at the end of the year. His goal was to determine what made strategic plans effective or ineffective. What did he find? That effective action plans are monitored. Without “consistent and frequent (at least monthly) analyses of student performance, teaching strategies, and leadership practices,” he found that action plans became an “educational autopsy—an analysis of last year's scores long after it's too late to do anything about them.” I’ve spoken personally with many district and site leaders that express that same experience— and how frustrating it can be.
Getting All of the Right Data in the Right Place
Second, I’ve found that huge chunks of data used for strategic planning and goal setting are still getting left out of data visualization tools. Even as student achievement, growth, attendance, behavior, and social emotional data are now living in one place for many districts, other important data continue to live in disparate spreadsheets and Google Docs.
This second challenge directly relates to another finding from Reeves’ study: effective plans are subject to evaluation. Reeves found that “that every program, initiative, and strategy in the school” should be “subjected to the relentless question, Is it working?” This question is very hard to answer when critical data still live in different places, aren’t in real time, or are laborious to understand.
Here are some of the most common data sources districts report that they struggle to marshal and visualize (alongside student data) for their action plans:
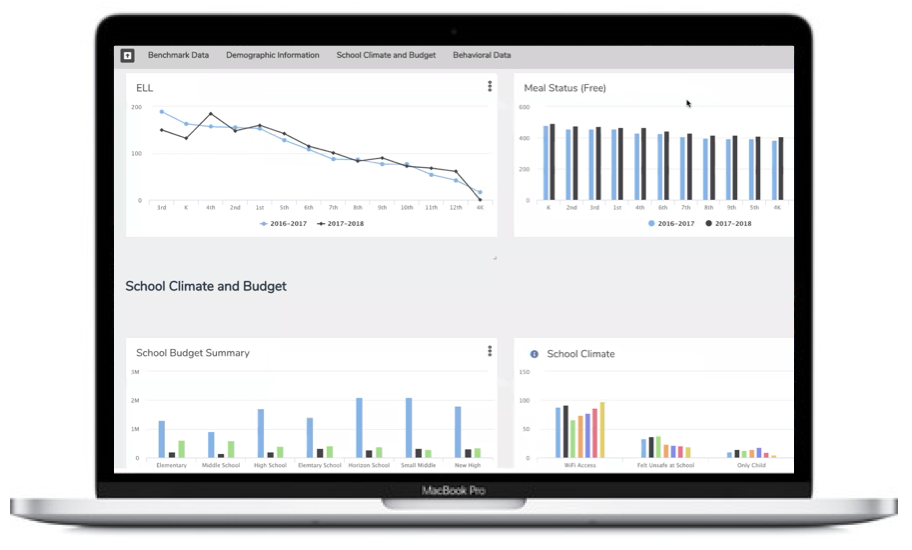
Climate, Survey, and Perception Data
Districts sometimes invest a great deal of time and resources into administering important surveys for students, teachers, parents, and the community. These surveys are typically used to gather anonymous data about school climate and engagement levels.

Professional Development & Professional Capacity
Tracking the time and allocation for professional development helps us ensure we’re aligning our staff development efforts to the needs of our students—and that all staff are on track to attain any required professional development hours.

Family & Community Engagement
Parent engagement is a major factor for student success, and engaging the community unlocks a variety of resources for personalized learning, funding, and MTSS support. Districts often collect data on participation and attendance for various programs and initiatives, but struggle to visualize trends and successes across different efforts.

Early Warning Data
As districts set up and refine their early warning systems, measuring the impact of our actions over time can be a difficult lens to grapple with. Here, districts aim to quickly answer the question: are there fewer at-risk students than last year?

Growth in Participation & Readiness
This might include metrics such as participation in AP classes, average GPAs, and graduation readiness. Often, those goals are set by school and need to be tracked over time.

Budget
Every district has various responsibilities around fiscal reporting. Tracking budget and expenditures throughout the year helps ensure alignment to student and staff needs and equitable distribution of resources.

As you may have seen, Illuminate released our newest product, Achievement Dashboard, this spring. We built Achievement Dashboard to answer not only these two challenges but address other needs, like built-in project management tools and visualizing progress toward goals. If you’d like to learn more about Achievement Dashboard, click here or contact us for more information.
*****
Illuminate Education is a provider of educational technology and services offering innovative data, assessment and student information solutions. Serving K-12 schools, our cloud-based software and services currently assist more than 1,600 school districts in promoting student achievement and success.
Ready to discover your one-stop shop for your district’s educational needs? Let’s talk.
