

February 27, 2020
Once your students have taken an assessment, it’s time to start analyzing your data. But where do you start?
This blog will explore two data analysis processes to help analyze your students’ assessment data: Patterns of need and root cause analysis.

What are patterns of need?
Patterns of need are meaningful patterns that emerge when data are visualized or organized in a way that supports data analysis and decision making. Patterns and needs should initially be analyzed separately.
Patterns
Patterns are common results in the data for a group of students. A pattern should be specific and allow you to target instruction where it is needed. For example, you might notice that although the average on an assessment was 85%, more than 70% of students missed questions 13, 14, and 15—indicating a pattern in your data.
Needs
Needs are areas that impact student performance. Continuing with our same example, we might find that questions 13, 14, and 15 were the only three questions that focused on a particular standard—a standard that is clearly causing students to struggle.
Areas of need may be skills-based or content-based. Need does not necessarily mean an area of weakness, however. There could be a need for enrichment if you identify a pattern of student strength.

How to identify patterns of need
When looking for patterns of need, we want to look for clusters of students. Doing so is not only more efficient and effective but also provides opportunities for answering “big picture” questions and examining our teaching practices.
When we focus our attention on clusters of students, it can also highlight a weakness in our instruction, curriculum, or another broader area.
Identifying patterns of need provides educators with two invaluable opportunities:
- Gaining a deep understanding of trends in students’ challenges and strengths.
- Brainstorming collaboratively around instructional strategies for enriching students’ strengths and building on areas where instruction can improve.
Let’s take a look at a specific example, based on the following report:
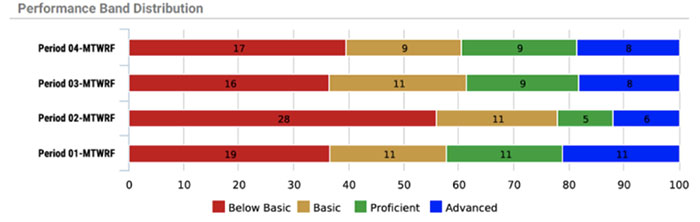
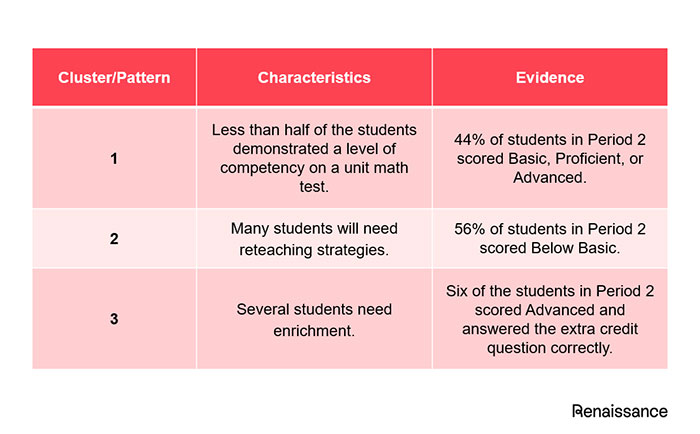
First, we review the data to look for patterns or clusters of students. Then, we articulate what we observe in our data (characteristics) and the specific data points that support those findings (the evidence). An example is shown below, focusing on the Period 2 class:
As you complete this work, you may find a number of clusters of students or patterns of need. However, not all patterns of need are equally important. As a team, determine which patterns of need stand to provide the highest impact if solved. These will be your priorities to address first.
Once a priority pattern of need is identified, we often feel a great deal of pressure to act. Solutions may be mandated, sometimes before a problem is fully understood. But without alignment to need, solutions only treat the symptoms of a problem—not the problem itself.
Root cause analysis helps us address the true problem underlying a pattern of need, instead of just the symptoms.
Insights to move learning forward
Discover assessment and analytics tools from Renaissance to better identify students’ needs.

What is root cause analysis?
Root cause analysis is a structured approach to uncovering the factors that resulted in a positive and/or negative pattern of need. The Massachusetts Department of Elementary and Secondary Education, for example, refers to a root cause as “an underlying factor or condition that creates a problem and that, if addressed, would eliminate or dramatically alleviate the problem.”
Too often, we focus on a symptom or quick fix to address an issue, only to find that the issue returns. Root cause analysis helps dissolve the actual problem, not just the symptom. It eliminates “patching” and wasting effort.
Root causes represent the deepest underlying factors that lead to a pattern—whether positive or negative. In other words, these may be either supports (positive) or barriers (negative) to student learning. If these root causes are addressed, educators can prevent negative recurrences and replicate and build upon positive effects.
What is the purpose of root cause analysis?
The purpose of root cause analysis is to determine:
- What happened
- Why it happened
- A course of action to address the true need or eliminate the root cause
Root cause analysis can help transform a reactive culture into a proactive culture that solves problems before they occur or escalate.
It’s important to note that root cause analysis is not intended to place blame on anyone. Rather, it’s intended to identify where the most energy and attention should be placed in order to get different results.
Root cause analysis template
So, how do we actually go about the process of root cause analysis?
There are a number of protocols that teams can follow. Protocols are based on the premise that adult behavior and district processes impact student learning outcomes. If we believe that all students can learn, and our data show us that students aren’t currently learning successfully, then we need to determine what we can do differently.
For our purposes here, we’ll highlight a frequently used protocol called the Fishbone Diagram Protocol:
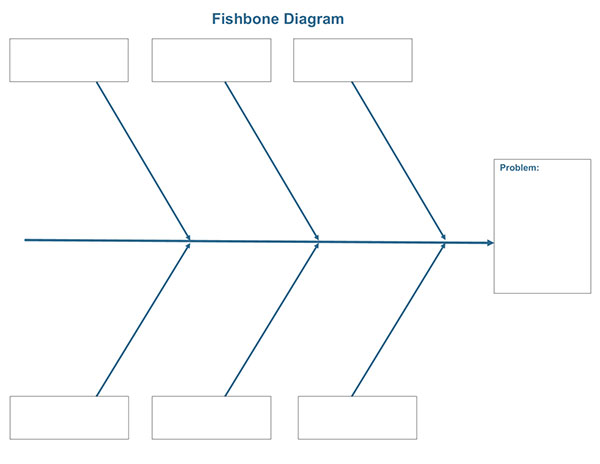
Here, teams generally pick six possible categories and brainstorm potential root causes for the pattern of need. Examples of categories include:
- Curriculum
- Assessment
- Instruction
- Professional knowledge and craft
- Culture and climate
- School processes
- Individual teacher
- Individual learner
- External factors
From here, the group eliminates any ideas that aren’t root causes—or are root causes that are out of the team’s control. Only some of the causes are controlled by the school, and we must focus solutions on the causes that we can influence in order to be effective.
Next, teams prioritize and choose a root cause area to address. Problems usually have multiple causes—and not all causes are equally important.
Finally, teams start to drill down to the underlying problem by continuing to ask, “Why?” From here, the group is able to design a plan to address the root cause they have identified.

How to analyze assessment data and perform root cause analysis in the classroom
Educators use assessment data as a tool in the classroom by collecting and evaluating the data to determine the root cause of an issue and then creating a path to correction through intervention and instruction.
Here are five ways to effectively utilize assessment analysis.
#1: Plan individual instruction and intervention
Whether through an MTSS or an RTI approach, instructional intervention is geared toward helping students improve skills they struggle with.
Analyzing assessment data provides educators with a starting point for creating individualized plans for struggling learners. A personalized plan may include:
- Skills that need to be addressed in the classroom
- Extra support strategies for the teacher
- A way to track progress
Assessment and reporting tools provide the data and statistics to help guide instructional interventions in the classroom.

#2: Develop instructional strategies
When educators can see the big picture, they can develop strategies to help students based on assessment data. Often, this involves grouping students based on the data. Questions such as…
- How many groups should I form?
- How will I arrange my schedule to make the time to meet with each group regularly?
- Where can I get the resources to meet the needs of each student?
- What are the other students doing while I’m working with a small group?
…can all be answered through analysis of assessment results.
#3: Create targeted goals for teachers and students
Using the information in the assessment analysis will help guide district leaders when determining specific goals that are relevant, measurable, and attainable. Educators can then ensure that student goals are aligned.
When students are involved in their assessment data and goals, they’re more likely to be invested in their overall success.
#4: Monitor progress
Leaders gain valuable information regarding improvements in critical skills, such as reading, math, and social-emotional behavior, with regular progress monitoring. When progress monitoring takes place often, it becomes familiar and expected for everyone involved, including students.
All-in-one assessment tools assess each student on the skills they most need to master. If the tool can adapt to the student’s ability, the student is less likely to become frustrated or discouraged, and the assessment data is going to be more accurate.
#5: Expose professional development gaps
Assessment data not only provides insight into students’ learning gaps but into professional development gaps as well. The information analyzed shows where the students are seeing the least amount of improvement, which may indicate a broader issue with instruction, whether at the universal tier (Tier 1) or in Tier 2 and Tier 3 interventions.
The right assessment tool will support educators by providing insight and guidance into practical and effective educational approaches to support student learning.

Renaissance: Providing valid and reliable data for improving student outcomes
Renaissance supports districts nationwide with assessments, analytics, and professional development that yields high-impact data-driven decisions in the classroom.
Our solutions include:
- FastBridge and Star Assessments for universal screening and progress monitoring in reading, math, and social-emotional behavior
- DnA for standards-based custom assessment
- eduCLIMBER for MTSS collaboration and management
Learn more
Connect with an expert to learn more about Renaissance solutions designed for today’s classrooms.