

 Illuminate Blog
FAST™ Feature Focus: Interpreting Screening Reports for Reading
By: Yvette Arañas
Now that you have collected benchmark screening data from your students, be sure to take the time to examine and interpret the data. Unfortunately, many assessments require someone to graph and interpret the data or provide reports that are hard for teachers to understand; but not all schools have someone (e.g., a school psychologist or an assessment coordinator) who can do that. Luckily, FAST™ automatically generates score reports with easy to understand information. Here is a guide to help teachers and other educators understand how to interpret FAST™ benchmark screening data for reading data.
Group Screening Report
Group Screening Report
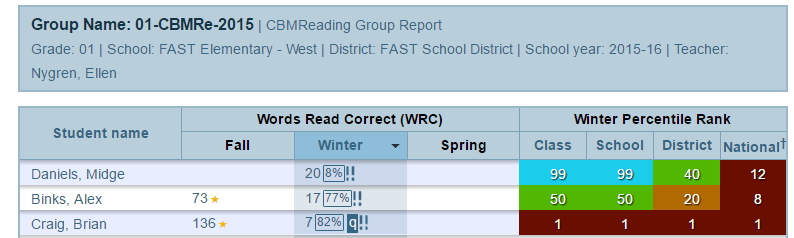
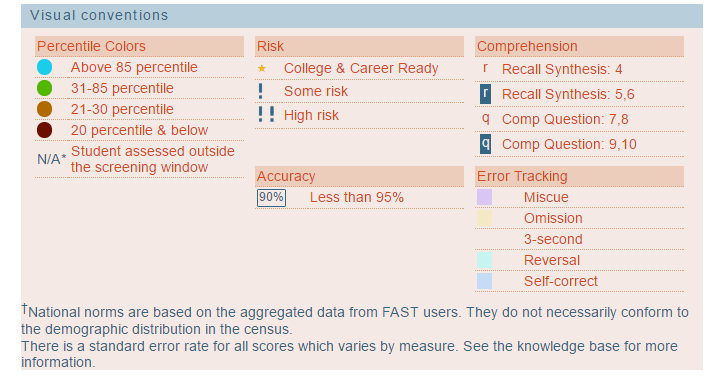
The first, and most basic, screening data report available is the Group Screening Report. These reports are available to show screening data for an entire class and for an entire grade level in a school. Above is an example of a group of students who were screened during the winter with CBMreading. At the bottom of every Group Screening Report, you will also find a guide to the colors and codes that are used to show each student’s reading skills and risk level (see Visual Conventions in FAST to the left).
Visual Conventions in FAST
Under the winter column of the screening report, you’ll notice that there is a number, a percentage, and some exclamation points. The first number indicates the student’s score; in this case, it is the number of words the student read correctly in a minute.
The boxed percentage data tell you the percentage of words that the student read correctly during the one-minute assessment; this is a measure of the student’s reading accuracy. In the example shown above, the student Midge Daniels read only 8% of the words correctly. According to reading research, a percentage below 95% suggests that the student might benefit from receiving interventions that target reading accuracy (rather than fluency). Thus, interventions that help students master decoding and phonics would be most appropriate for all the students in the example shown above. If students reach an accuracy percentage above 95% but are still not meeting grade-level expectations, interventions for reading speed and fluency would be more appropriate.
Exclamation points display for students whose screening score puts them at some risk (indicated by one exclamation point) or high risk (indicated by two exclamation points) of reading difficulty. These risk levels are calculated based on how the student compares to a national sample of students who completed CBMreading during the same benchmark time frame. If a student’s score falls at or within 16-40th percentile of all students in his or her grade level, the student would be identified as having some risk of reading difficulties. Those students whose screening scores are at or below the 15th percentile have a high risk of significant reading difficulties. It is important to note that all screening scores must be compared with other sources of information about a student’s reading performance, such as classroom assessments and local or state-required tests. Accurate identification of learning difficulties requires multiple methods and sources of data.
Comprehension codes may also appear next to the student’s score if they take the comprehension portion of the CBMreading passages: CBMcomprehension. You might notice that the student Brian Craig has a q next to his score. If you look at the visual conventions guide, you will see that the q means “Comp Question: 9, 10”; this means that the student was able to answer 9 to 10 (out of 10 total questions) correctly. Keep in mind that if the optional comprehension component of this assessment is used, students finish reading a passage after the one-minute limit is finished in order to answer the comprehension questions. In Brian Craig’s case, the data show that he is a very slow reader and that his accuracy could use some support; however, he was still able to comprehend the text. In this case, Brian’s slower reading fluency appears to help him make sense of the words and sentences he reads. If Brian’s screening scores are consistent with other indicators of his reading performance, it is likely that he would benefit from a reading fluency intervention.
Another feature available in the Group Screening Report is the option to compare a student’s performance to other students at the same class, school, and district, as well as at the national level. These comparisons are shown under the column “Winter Percentile Rank’. Percentile ranks tell us where an individual student’s score falls when compared to students in the same class, grade, district or national sample. When we look at Alex Binks’ performance at the district level, we can see that he scored the same or better than 20% of all first graders in his district; by comparison, he scored the same or better than 8% of first graders nationwide. The discrepancy between these two percentile ranks suggests that, on average, the first graders in his district scored lower than first graders who were tested around the entire country.
Errors and Notes
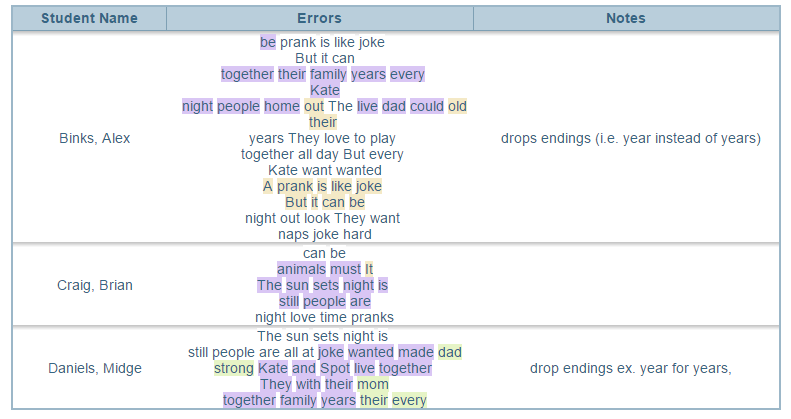
The screening report also shows the test examiner’s notes and the words that the student omitted or read incorrectly. The visual conventions guide shown above also helps us see what type of errors were committed. Here, it looks like the students mostly made miscues (e.g., they said a word that was different from what was printed on the page), omitted words, or could not read a word within three seconds. A student’s error pattern can be helpful for planning instruction because a student might show distinct patterns in his or her errors.
Individual Student Reports
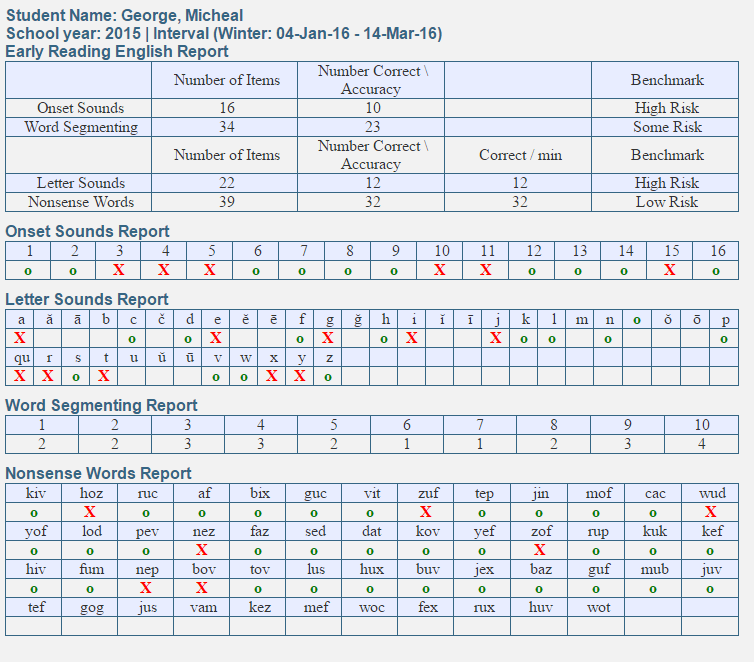
The individual student reports in FAST™ are helpful for teachers who want to keep an inventory of items that the student has read correctly and incorrectly. Below is an example of an individual report for earlyReading.
earlyReading Skills and Inventories Report
The earlyReading Skills and Inventories Report provides information about the pre-reading skills that each student exhibited during screening (shown left). When looking at this student’s report for Letter Sounds, we can see the letters that the student has identified correctly by looking at which letters were marked with a green “o.” A red “X” shows which ones the student identified incorrectly. Thus, the student’s intervention should address the letter sounds that the student got wrong. The same interpretation can be used for other skills tested (e.g., onset sounds, word segmenting, nonsense words). Here, we can see whether there are certain sound-symbol combinations that the student struggles with the most.
The student skills report is presented differently for aReading because aReading covers a broader scope of reading skills compared to earlyReading and CBMreading.
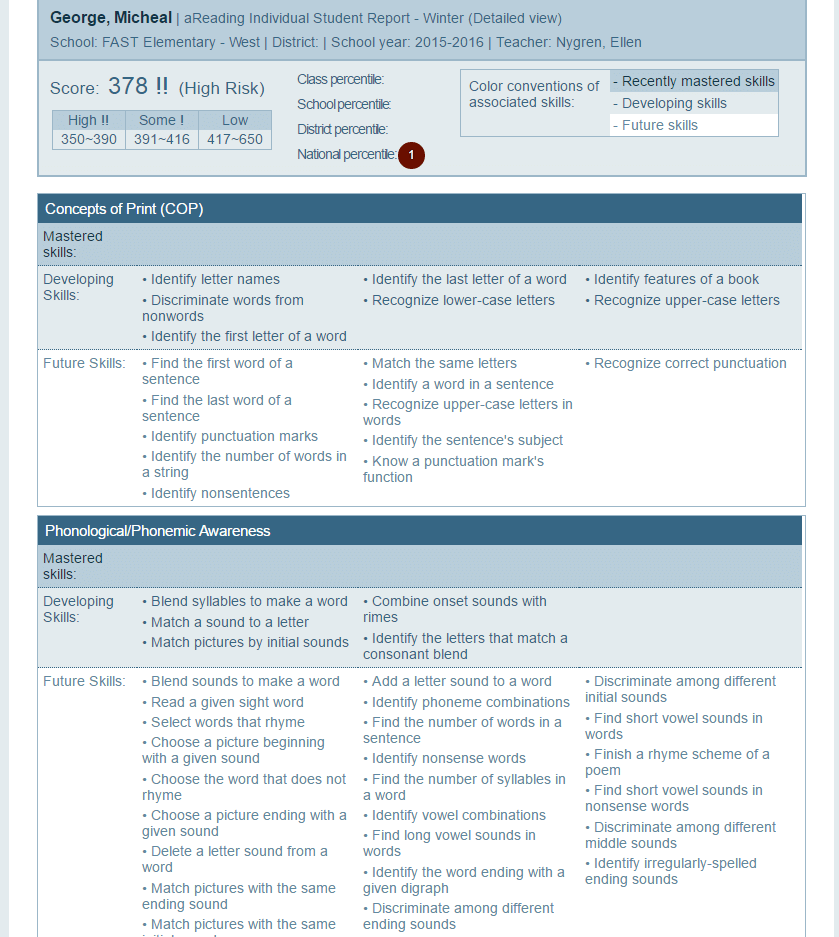
aReading Individual Skills Report
aReading contains items that address the Common Core State Standards (ELA) domains of Concepts of Print, Phonological/ Phonemic Awareness, Phonics, Vocabulary, and Comprehension. Under each domain, the Individual Skills Report (shown left) shows which skills the student has mastered (i.e., which skills can be done independently), which skills they are still developing (i.e., skills that need support), and which skills are expected to develop in the future (i.e., the skills the student has not learned yet). These skills reflect the standards cited in the CCSS. In the example shown to the left, it appears that the student has not mastered any skills yet for Concepts of Print and Phonological/Phonemic Awareness.
Individual Benchmark Comparison Report
For students who have taken a screening assessment multiple times, we can use the Individual Benchmark Comparison Report to examine the student’s general growth over time.
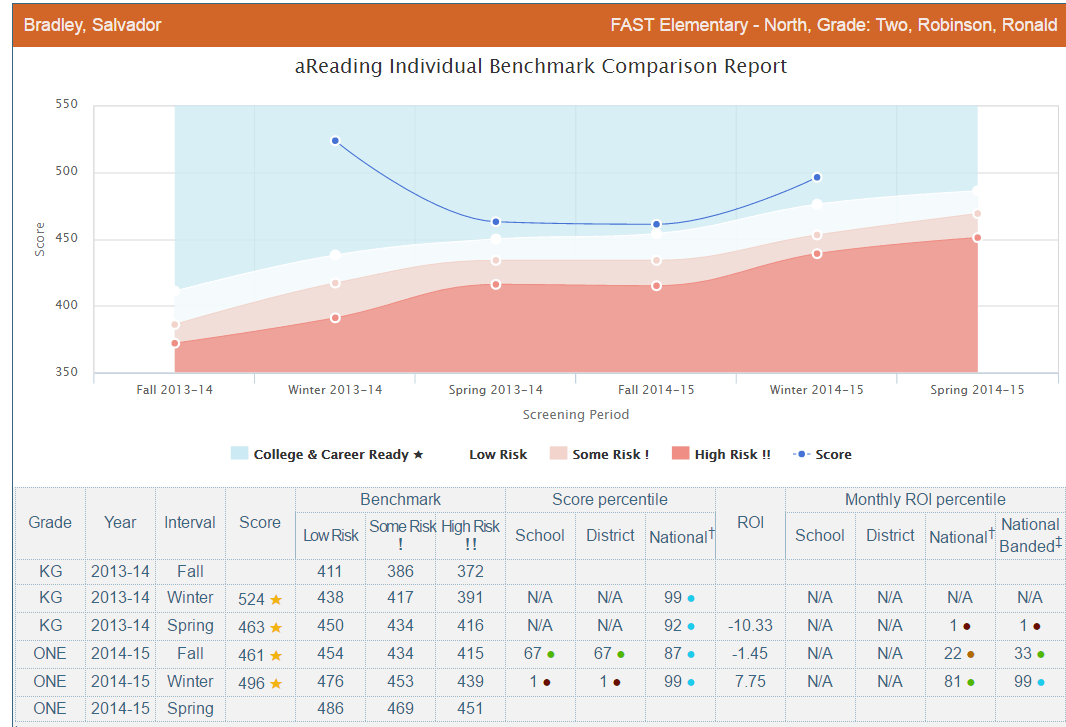
aReading Individual Benchmark Comparison Report
Here (see example below), we can see how the student’s scores compare to national grade-level expectations and how they have changed over time. It appears that the student consistently met grade-level expectations and has never been at risk; however, the student’s score decreased from the first time he took the assessment and has yet to reach his initial score again. Although this student is meeting benchmark expectations, his teachers may want to find ways to continue giving him instructional supports that will help him improve so that he does not regress.
Obviously, there are many different ways to interpret screening data and the aReading measure in FAST™ provides many options. Teachers and school teams must determine which reading scores are the most important for their students. We hope that this guide will help you understand your assessment data and guide decisions based on the data.
Yvette Arañas is a doctoral student at the University of Minnesota. She was a part of FastBridge Learning’s research team for four years and contributed to developing the FAST™ reading assessments. Yvette is currently completing an internship in school psychology at a rural district in Minnesota.
