

 Illuminate Blog
Benchmarks, Norms, and Expected Student Growth
Many teachers are in the process of conducting fall universal screening with all students in their class. Universal screening involves having all of the students in each grade complete assessments showing their current proficiency with grade-level skills. These screening scores can provide information about which students are on track, and which students might need extra support. FastBridge Learning publishes a number of different screening measures for reading, math, and behavior. On the FAST™ Group Screening Report, teachers can view these screening scores along with benchmark and normative information.
Benchmarks and Norms
To briefly review, a benchmark is a goal or target that students should meet to be successful. For example, a 3rd grade student should be reading greater than 90 words correctly per minute on the fall CBMreading assessment. Students who are not yet meeting this goal might be at risk for not meeting end-of-year goals in reading or on other assessments. A norm, on the other hand, is a peer comparison. A teacher can view how a student’s score compares to other same-grade students in the class, grade, district, or even nationally. On the FAST™ Group Screening Report, benchmark information is provided via exclamation points, and normative information is displayed via color-coded percentile ranks (Figure 1).

Figure 1
Teachers often want to access the benchmarks, or targets, outside of a report. Knowing the benchmarks for different grades and assessments can be helpful in instructional planning or goal setting. Starting this school year, there is an easier way to access the FAST benchmarks you need.
First, click on “Benchmarks & Norms” in the fast tools menu (Figure 2).

Figure 2
Next, you will see a screen where you can select one or more assessments and grades (Figure 3).
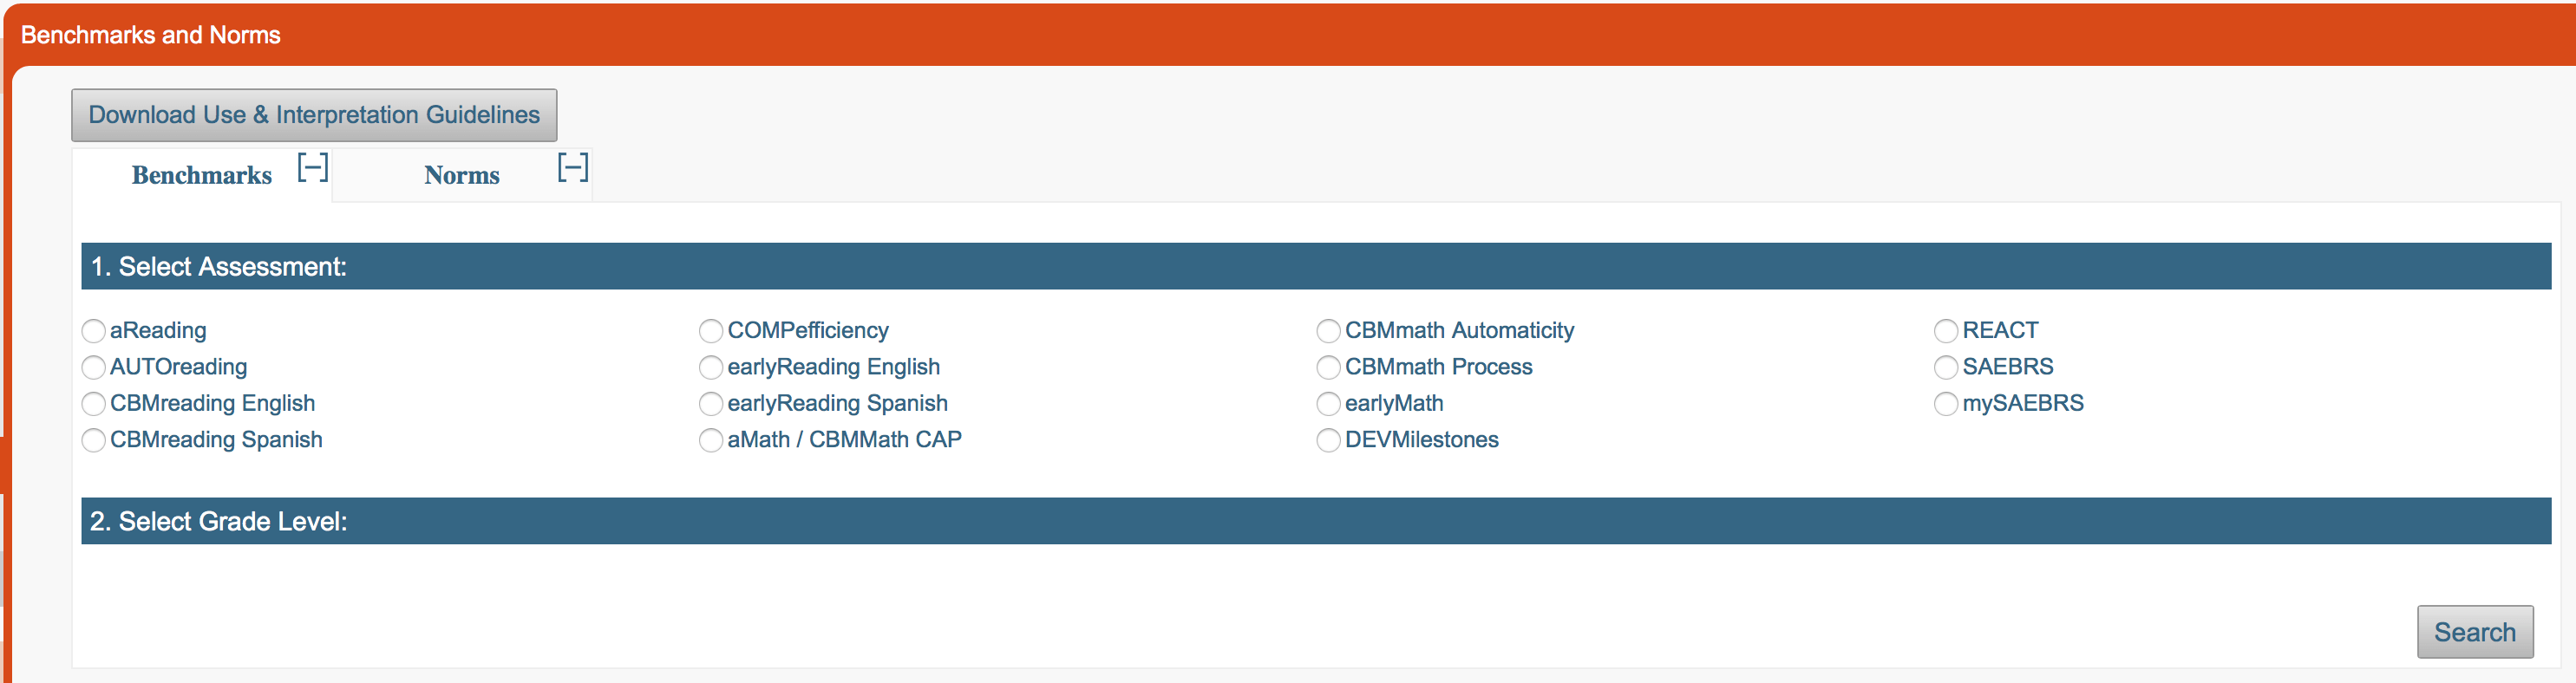
Figure 3
For this example, we will select CBMreading, grade 3 (Figure 4).
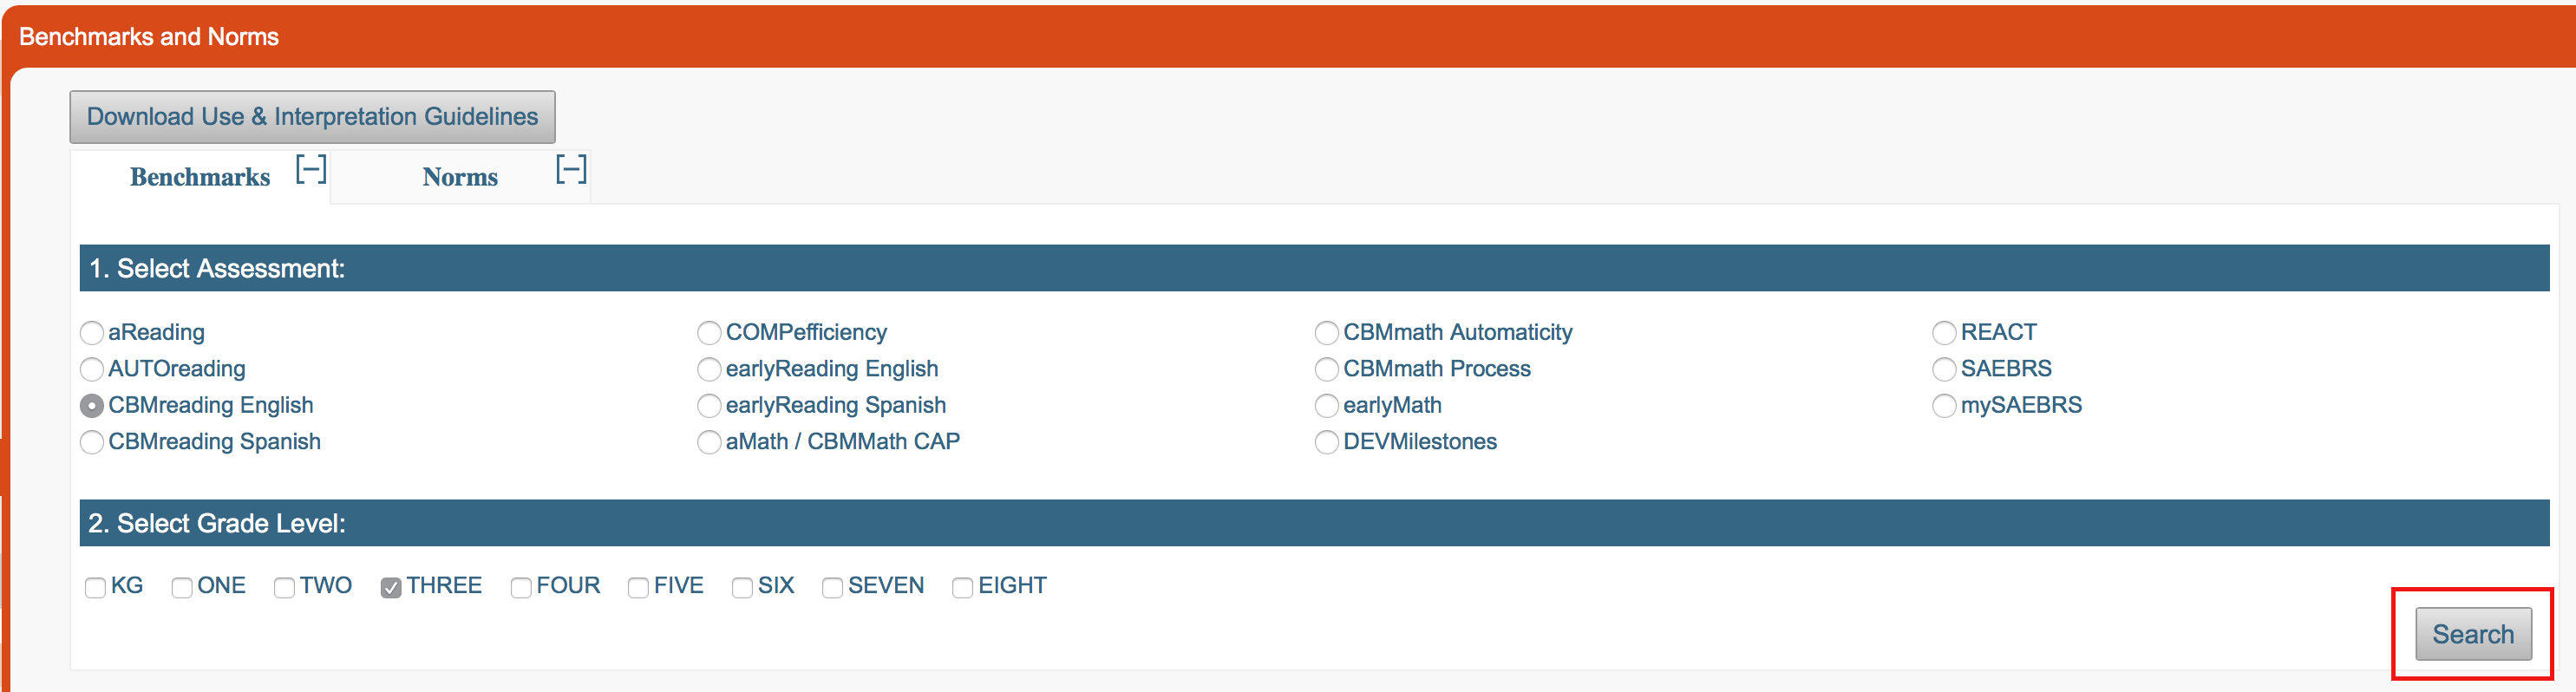
Figure 4
Then click “search”. You will see a display of only those benchmarks you selected (Figure 5).
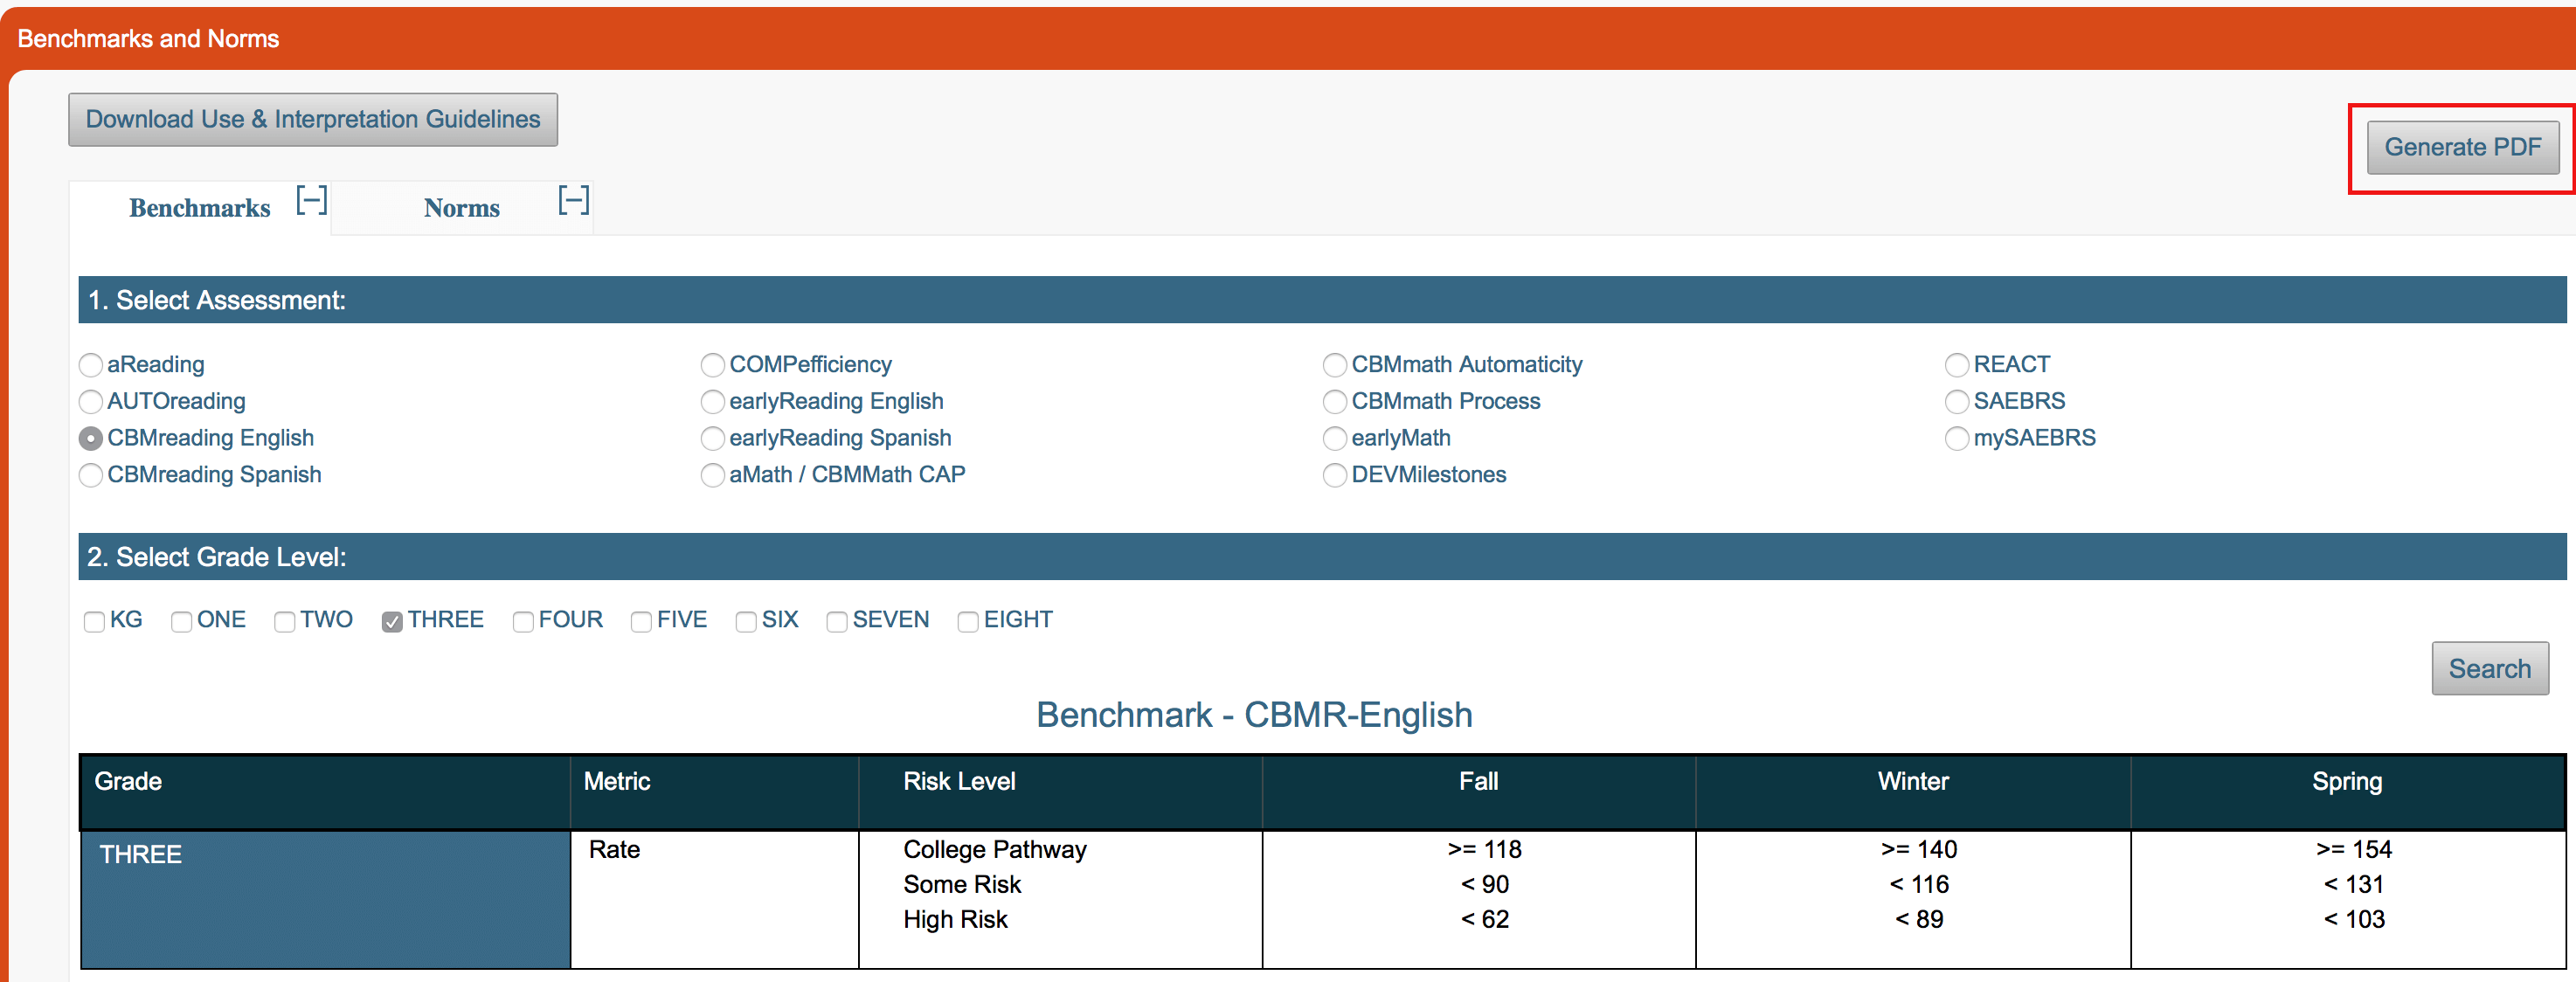
Figure 5
Note that you can also select Norms, instead of Benchmarks, on the tabs on the top of this screen.
You can also generate a PDF of the selected benchmarks or norms by clicking the “Generate PDF” button in the top right corner. This will generate a document that is formatted for printing or sharing. The PDF could be useful to bring to team planning or goal setting meetings. For those who may be interested in the development and interpretation of the FAST™ benchmarks and norms, click “Download Use & Interpretation Guidelines” for more details.
So, benchmarks and norms can provide a way to classify student skill or risk level now. But what about growth or improvement over time? The FAST™ Group Growth Report (Figure 6) provides a student’s average weekly or monthly growth.
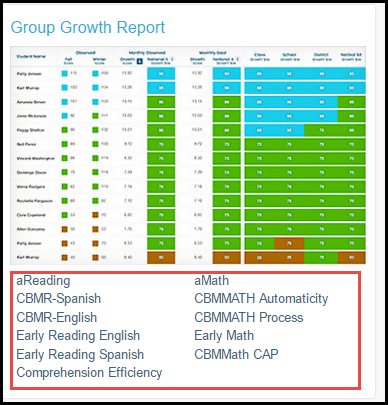
Figure 6
For example, if a student had a score for CBMreading in the fall and winter of the school year, the Growth Report would determine the average weekly growth between those two scores. This is called the Rate of Improvement (ROI). ROI is also reported on some individual student reports. The ROI can be difficult to interpret on its own. Therefore, the Growth Report also provides a ROI Percentile Rank. Similar to the percentile rank on a Screening Report, a student’s ROI is compared to the ROIs of other students in the same class, school, and district, as well as nationally.
Similar to the percentile rank on a Screening Report, a student’s ROI is compared to the ROIs of other students in the same class, school, and district as well as nationally.
The ROI percentile ranks compare the student’s growth to the growth of other students in the same class, grade, district and across the U.S. For example, a 3rd grade student’s ROI from winter to spring would be compared to other 3rd-graders’ ROIs from winter to spring. The ROI ranking shows how much growth a student made as compared to other similar students. Growth norms are also accessible through the Benchmarks & Norms described above.
In contrast to the Screening report, which displays student performance at one point in time, the Growth report is useful for understanding student growth over time. With this report, educators can identify students who are “beating the odds” for their start score. For example, a student with a start score or initial screening score in the At Risk category, but whose ROI percentile rank is 70, is growing as well as or better than 70% of students in that group. Something is working well for that student. In contrast, a student who did not start at risk, but has a very low ROI percentile rank of 5, is growing as well as or better than only 5% of students in that category. Such a student might have started out on grade level, but not make enough progress to stay on grade level. You might choose to watch that student more closely. Keep in mind that frequent progress monitoring is the best way to closely track a student’s growth.
To summarize, FAST™ provides easy access to benchmark information as well as normative or peer comparison information. These two types of information are available by assessment and grade, through the Benchmarks & Norms interface, as well as through Group Screening and Group Growth reports. By understanding a student’s level rate of growth, you can most effectively allocate your teaching resources to improve your students’ outcomes.
Kirsten Newell is a school psychologist and doctoral student at the University of Minnesota–Twin Cities. She worked in schools for four years before she became a part of FastBridge Learning’s research team for the past three years. She has contributed to development and refinement of various FAST™ training materials, reports, and interfaces.
