Getting Started:
Program Evaluation provides one-click data disaggregation by school, grade, gender, and ethnicity over time. Use the Program Evaluation Module to intentionally explore risk levels and proficiency for groups of students, visualize overall trends and improvement, and reveal longitudinal patterns in student outcomes. Toggle in additional filters for different groups of students, programs, or interventions to isolate and examine differences in outcomes.
Note: System administrators have the option to activate this feature for individual users. Reach out to your system administrator if you do not see it available in your account.

Digging Deeper:
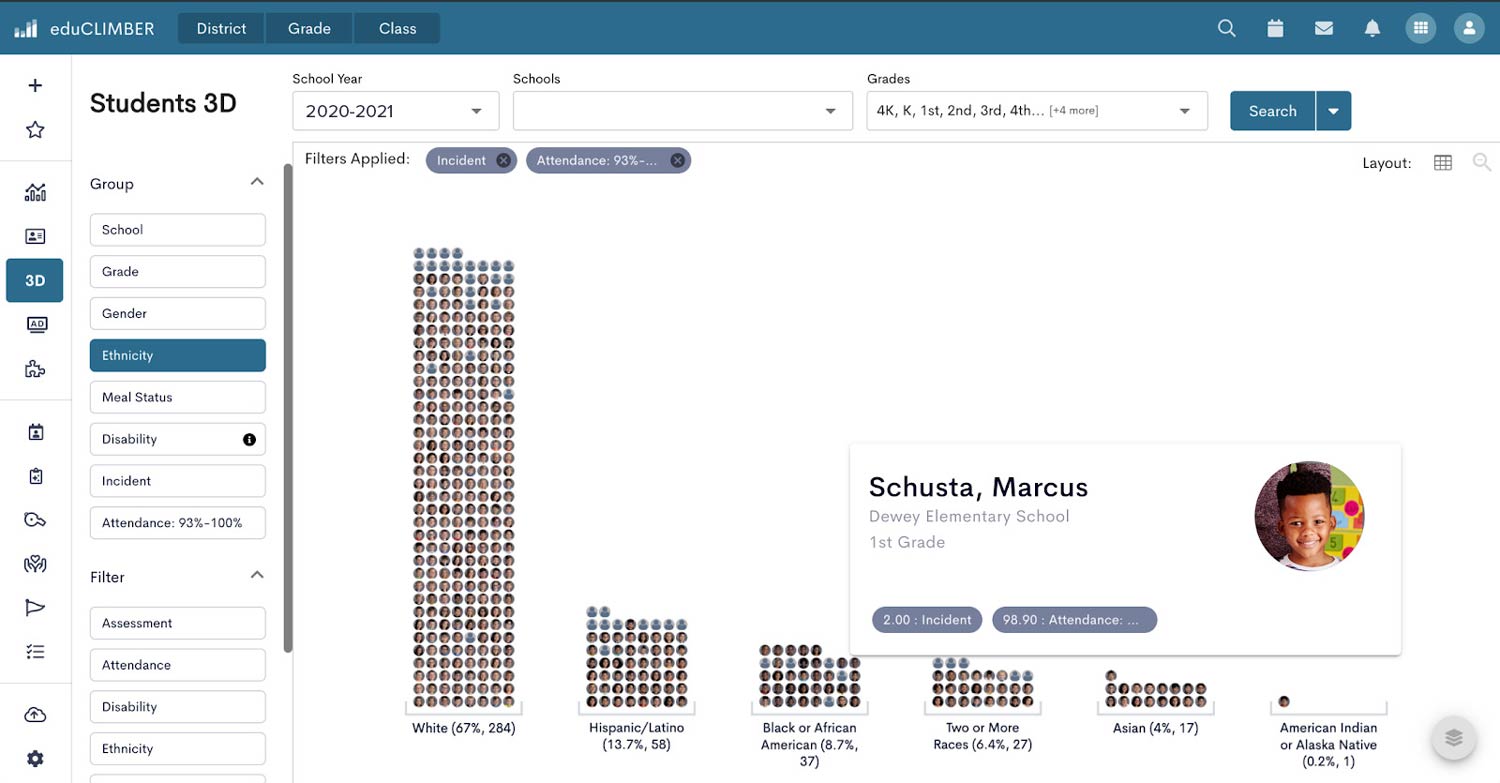
Students 3D is a Dynamic Data Definer that enables teams to "slice and dice" data, reveal patterns in data outcomes, and explore areas of inequity. Apply filters to isolate results and patterns in assessment, attendance, incident, and other data for specific groups of students (e.g., by ethnicity, by intervention, by program). Visualize which students are (or aren't) benefiting from additional supports by examining data by intervention, by tier, and more. Create and combine various filters to reveal trends across data sources that might otherwise go undetected.