

 Illuminate Blog
Using Progress Monitoring Data to Make Instructional Decisions
By Yvette Aranas
Last week, I explained that progress monitoring is used for students receiving interventions in addition to their general curriculum. When a student is receiving Tier II and Tier III interventions, it is important to identify whether the interventions are working. Unfortunately, some educators may not know when it is appropriate to change the instruction. Today’s blog offers some guidance for using progress monitoring data to decide whether to change or maintain an intervention.
Setting a Goal
First, any decisions about changing or continuing an intervention should be based on data (i.e., information from your student’s performance on progress monitoring measures). After screening a student, his/her score serves as a baseline (i.e., starting point) for their performance prior to receiving instruction on the skill being measured. Then, an end-of-the-year goal for the student is established based on the student’s starting point and the assessment’s growth norms (Fuchs & Fuchs, 2001). You can find information on growth in FastBridge Learning’s Benchmarks and Norms Manual, which provides norms for weekly growth.
FastBridge Learning automatically sets the goal when you create a progress monitoring group. The image below is an example of what a user would see when creating a group. This particular student is being assessed on CBMmath Automaticity. His starting point is 57 correctly answered items and his end-of-the-year (EOY) goal is 80 correctly answered items. The goal is based on his starting point and the expected weekly gains from FastBridge Learning’s normative sample. Note that the FAST system allows you to manually adjust the weekly growth rate to set a more ambitious or realistic goal. FAST also suggests an expected benchmark for the student, which is the end-of-the-year score that students in his/her grade level are expected to reach to show proficiency.

Example: Setting Progress Monitoring Goal in FAST
Using Your Progress Monitoring Data
I mentioned in my previous blog post that it is important to collect enough data about a student while you are implementing an intervention. When you are setting up your progress monitoring group, you can also establish how frequently you will monitor your student’s progress. We recommend monitoring progress at least once a week (which is the default in FAST). In addition, we suggest to have at least eight weeks of data before changing your intervention. We also advise to consistently implement the same intervention (with fidelity, of course) across the eight weeks. Making changes to instruction too soon will make it difficult to determine whether a particular intervention is effectively targeting the student’s needs.
Interpreting the Progress Monitoring Graph: FastBridge Learning provides a graph that shows the goal line (i.e., the line that goes from the starting point to the end of the year goal), the line that best fits the student’s progress monitoring data, and a benchmark line (which indicates where a student needs to be for a particular benchmark season). In the example below, the goal line is represented by a dotted blue line. The progress monitoring trend line is the solid blue line surrounded by the data points. The benchmark is a horizontal solid black line; here, the benchmark line shows that students are expected to read 116 words per minute in the fall.
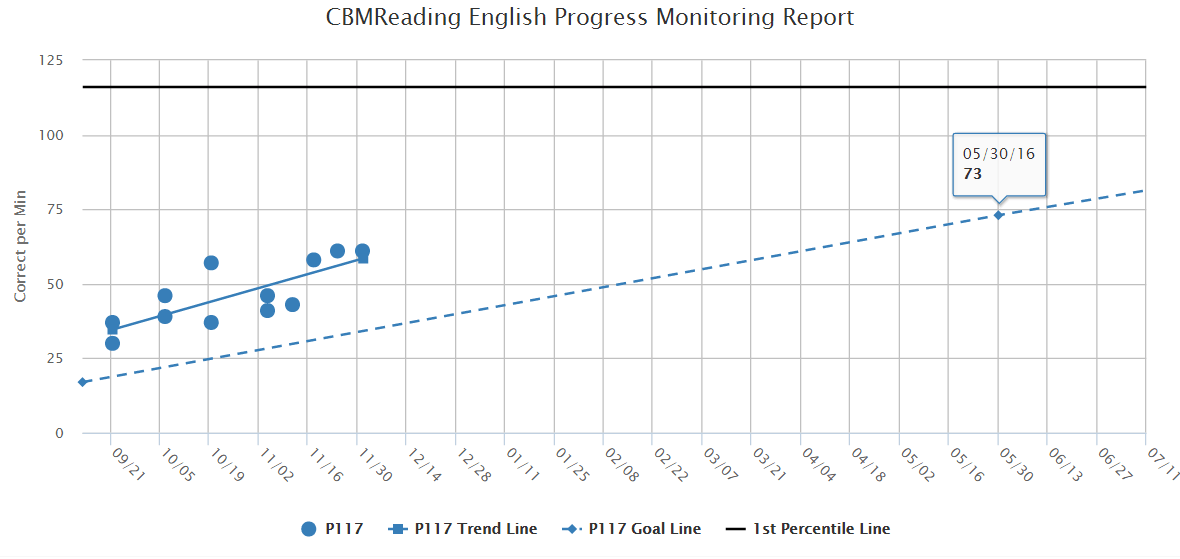
Example: Trend Line Graph with Benchmark in FAST
Examining the Trend Line: When looking at the trend line, check to see if it is increasing. If it is, this means the student is making some improvement (which is what we want). If it is flat, the student hasn’t made much gain from the start to the latest progress monitoring date. If it is decreasing, the student’s progress is actually getting worse. Next, look to see where the trend line is located in relation to the goal line. If the trend line is falling below the goal line, you might want to consider increasing the intensity of the intervention (e.g., meeting more often or implementing it one on one), or changing the intervention altogether. In the example below, the student’s trend line is increasing and falls above the goal line.
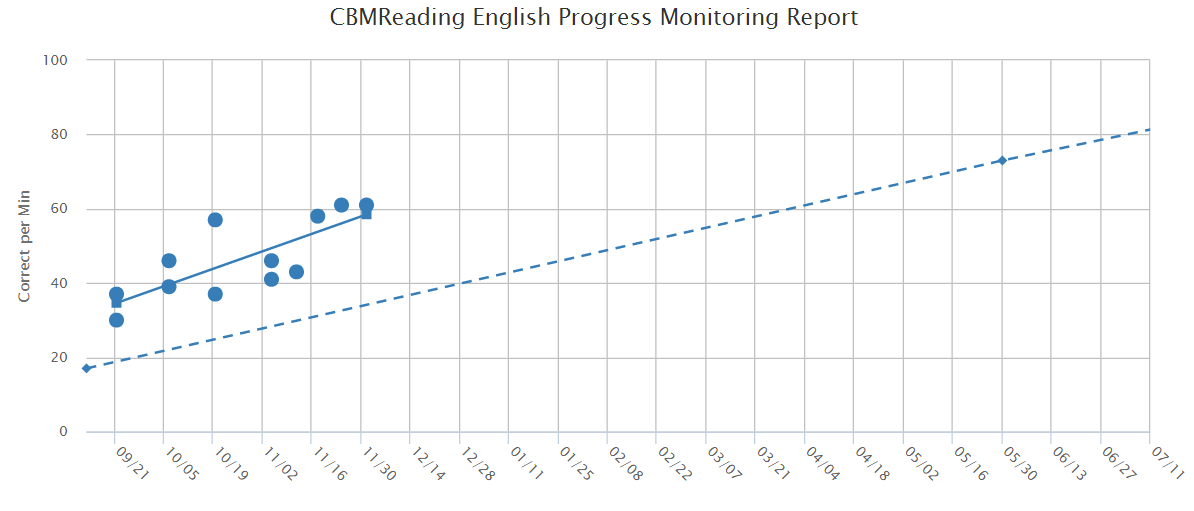
Example: Three Data Points Above the Goal Line
One other thing to examine is the last three data points of your trend line. If the last three points are above the goal line (as in the example above), you may choose to continue implementing the current instruction and increase the goal if you believe the goal is too easy for the student. If the last three points are below the goal line (as in the example below), modify the intervention and keep the goal the same.
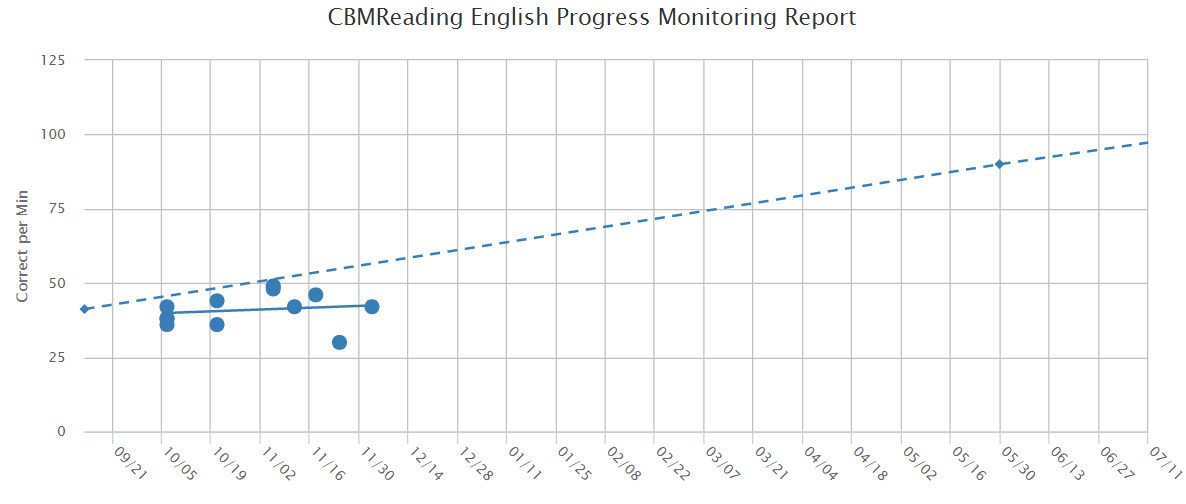
Example: Three Data Points Below Goal Line
If the last three points are inconsistent and falling below and above the goal line (like in the example below), keep implementing your intervention and keep your goal the same.

Example: Three Inconsistent Data Points
After considering the possibilities mentioned above, determine whether your student has met the goal and whether he or she no longer needs support from your intervention. If this is the case, you should consider “graduating” the student from the intervention.
Accuracy: When looking at your progress monitoring data, one thing to consider is the student’s accuracy. FastBridge Learning’s individual progress monitoring report provides the percentage of items that a student answered correctly if the accuracy falls below 95%. If your student is getting fewer than 95% of the items correct, an intervention targeting accuracy should be implemented. Below is an example student’s graph, where a downward triangle indicates the times in which the student had less than 95% accuracy when reading a CBMreading progress monitoring probe.
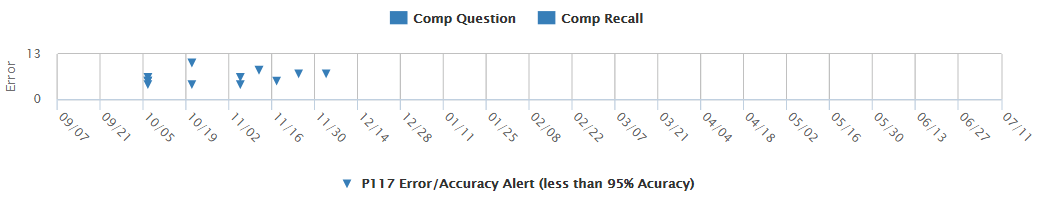
Example: Accuracy – CBMreading Progress Monitoring
We hope that this information will help you better interpret your progress monitoring data and guide your intervention and instruction!
Reference
Fuchs, L.S. & Fuchs, D. (2001). What is scientifically-based research on progress monitoring? National Center of Student Progress Monitoring. Retrieved from http://eric.ed.gov/?id=ED502460.
Yvette Arañas is a doctoral student at the University of Minnesota. She was a part of FastBridge Learning’s research team for four years and contributed to developing the FAST™ reading assessments. Yvette is currently completing an internship in school psychology at a rural district in Minnesota.
