Gain Clarity into the Best Next Steps
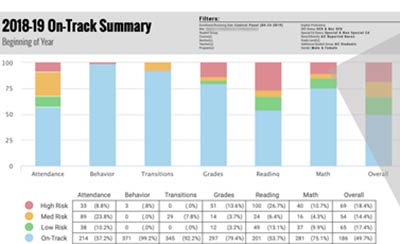
The right data visualizations can be the difference between collecting data and making data-driven decisions that positively impact teaching and learning. Explore how our interactive visualizations can help you to target essential questions, discover key insights, and reveal the right next steps to take at the student, class, school, and district levels.
A Launch Pad
for Action
Put your next steps in motion with visualizations connected to workflow tools, like intervention tracking and action item management
Your Data,
Displayed Your Way
Use pre-built visualizations or create your own to meet your unique needs
Interactivity to Help Reveal Patterns
Filter and drill down into interactive reports to reveal patterns across student groups


