

 Illuminate Blog
Understanding Your Screening Data
By: Jessie Kember
As mentioned in a previous post (Assessment Literacy: Understanding Student Data), assessment serves as a core foundational component of decision-making within a Multi-Tier System of Support (MTSS) framework. Two broad categories of assessment within an MTSS framework are screening and progress monitoring. The purpose of this blog is to explain the scope and purpose of screening data, as well as provide some background information to assist educators with understanding and interpreting screening data.
When implemented purposefully and with fidelity, an MTSS framework allows educators to use universal screening measures to identify students who are struggling to meet one or more school learning goals. “Universal” refers to the fact that screening is conducted with all students. This is done because there are many ways that a student could encounter school difficulties and not all students who struggle in school have a disability. Instead, some students might have experienced family transitions such as moving due to economic need or military service. This process of identifying students with learning or behavioral difficulties relies on educators’ ability to understand student screening data. Evaluating, interpreting, and understanding screening data allows educators to use data to inform both instruction and intervention at the individual, class, and school levels.
Within an MTSS framework, universal screening is typically conducted three times per year (fall, winter, and spring) and can target all school outcomes, including both academics and behavior. It is important that screening occurs periodically throughout the school year to regularly assess student performance. Students who perform adequately during the fall may show decreased growth at the winter screening period, indicating a need for instructional changes.
An effective screening measure is easy to administer, and simple to complete and score. FAST™ assists educators with the screening process by providing simple, brief screening measures that automatically generate reports with easy to understand scores and information.
FAST™ Screening Measures
Available FAST™ screening measures include:
| FASTreading | FASTmath | Behavior |
| aReading
earlyReading CBMreading AUTOreading (Lab) COMPefficiency (Lab) |
aMath
earlyMath CBMmath-Automaticity CBMmath-Process CBMmath-Concepts & Applications (CAP) |
DevMilestones
SAEBRS mySAEBRS |
FastBridge Learning recommends conducting universal screening in the fall, winter, and spring of each school year to help educators make informed decisions about instruction at the individual, class, and school level. Regular screening provides educators with data on student growth over time.
FAST Screening Reports
In order to correctly identify those students at risk of learning or behavioral difficulties, it is important for educators to understand how to interpret screening data. A sample FAST™ screening report for aReading is shown below (Figure 1). Interpreting screening data requires a basic understanding of two important types of scores that appear on all FAST™ screening reports: Normative Scores (i.e., norms) and Benchmark Scores. When interpreting screening data, it is important to evaluate both benchmarks and norms in order to fully understand a student’s performance. FAST™ screening reports display data for each available screening period. While the following symbols and color codes are not an exhaustive list of all report components across all FAST™ screening measures, they represent the components present on all FAST™ screening reports.
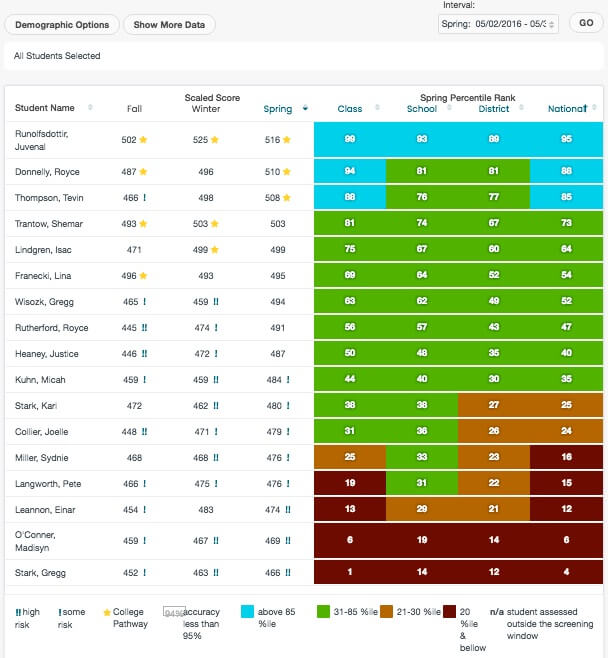
Figure 1. Sample Screening Report in FAST™
Norms. Norms, or normative scores, are average scores of large groups of students. Norms reflect typical performance of students at each grade level. It is important to remember that FAST™ norms are updated annually to reflect the most recent data. The purpose of norms is to establish a baseline against which a student’s score can be compared. FAST™ screening reports include notation to help interpret student performance in the context of norms. For example, student scores are color-coded to show whether each student’s score is below, at, or above the norms. Each of these color codes is matched to a specific range of percentile ranks, as follows:

Figure 2
Higher percentile ranks indicate better performance. FAST™ screening reports include norms for the class, school, district, and nation. Teachers can then compare student performance in relation to each of these groups. Color codes may vary for an individual student across these percentile rank groups. In other words, it is possible for a student to perform above the 85th percentile at the school level, but between the 31st and 85th percentile at the national level.
Benchmarks. The other type of score comparison that FAST™ uses is a benchmark. Benchmarks are actually developed from norms but are specific to each school or district’s identified learning goals or standards. FAST™ provides benchmark scores by grade level and time of year (e.g., fall, winter, and spring) for each available screening measure. For example, there will be different benchmarks for the fall, winter, and spring student assessments. Benchmark scores allow educators to identify which students are at risk for achievement or behavioral difficulties. FAST™ sets default benchmark score levels so that all students’ scores are organized into four levels: high risk, some risk, low risk, and “college pathways.” The high risk indicator defaults to the 15th percentile and the some risk is set at the 40th percentile. Schools may set their own custom benchmark levels.
Instead of color codes, FAST™ uses exclamation marks to show a student’s risk level. Student scores without exclamation marks are at low risk, those with one exclamation mark (!) are at some risk, and those with two exclamation marks (!!) are at high risk of achievement difficulties. There is not a no-risk category because it is impossible to predict with 100% accuracy if a student will meet all learning targets and always be successful in school. When reviewing FAST™ screening score reports, teachers will know to take the most immediate steps to help those students with two exclamation marks. The sooner that intervention is provided for such students, the more likely they are to catch up to peers and reach the benchmark goal. The yellow star or “college pathways” symbol identifies those students performing at or above the 70th percentile in Kindergarten through 8th grade, and those students performing at or above the 75th percentile in 9th through 12th grades. This provides educators with a comparison to published research on ACT, SAT, and other college entrance performance standards. If the student is assessed outside of the designated FAST™ screening window (i.e., fall, winter, or spring screening period), an “n/a” will appear on the screening report in place of the color-coded percentile rank.
Screening Leads to Progress Monitoring
While both screening and progress monitoring are foundational components of an MTSS, screening and progress monitoring measures are very different. More importantly, the data that these measures produce are collected for different purposes and therefore need to be interpreted differently. As mentioned previously, screening data are used to identify students with learning and behavioral difficulties. Progress monitoring data are used to set goals for students. Progress monitoring measures are administered more frequently than screening measures. While it is recommended that screening measures be utilized on three occasions throughout the school year, progress monitoring is typically used weekly or bi-weekly. Another important difference is that screening involves all students (Tier 1), while progress monitoring is typically reserved for students identified for Tier 2 or Tier 3 intervention within an MTSS model. Finally, not all designated FAST™ screening assessments can also be used for monitoring student progress.
Jessie Kember is a doctoral student at the University of Minnesota–Twin Cities. She was a part of FastBridge Learning’s research team for four years and contributed to the development and refinement of various FAST™ reading assessments. Jessie is currently completing an internship in school psychology at a school district in Colorado.
