

 Illuminate Blog
Identifying the Problem of Percentile Ranks
In education, we frequently use the “Percentile Rank” score a student receives on tests to report to parents and understand how that student performs. As educators we really like the percentile rank because it seems easy and intuitive to understand. However, this article will present some cautionary concepts when using the percentile rank scores on assessments.
Percentile ranks or percentile scores are defined with respect to a “norm” or reference group. As such, percentile scores provide a convenient way to convey an individual’s standing on a test relative to others. An individual that scores at the 25th percentile scores above 25% of those taking the test, while an individual that has a percentile rank score of 95 scores above 95% of the test takers. This simple interpretation is what is so appealing to educators regarding percentile ranks.
Percentile scores are actually a statistical transformation of the underlying test raw scores and a score called a “standard score.” This statistical transformation places the raw scores and standard scores on a “Normal” or “Bell” curve.
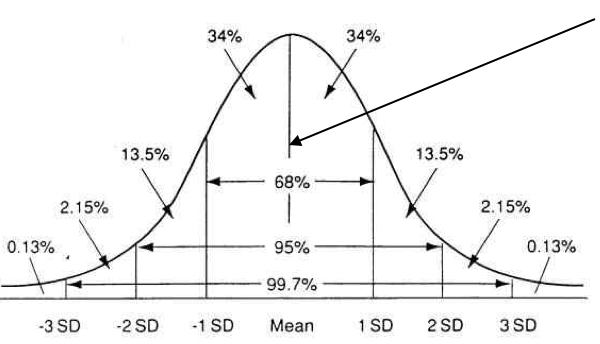
The diagram above shows a bell curve that most of us are familiar with. The problem is that percentile ranks are not equal in interval along the normal curve. In fact, nearly 70% of all percentile rank scores bunch up in “rectangle” in the middle of the distribution call the “average” range. You can see the average range by the 68% range in the middle. Since the majority of percentile ranks bunch up in the middle, any small change in actual test raw/standard score for an average student can represent a very large change in percentile rank.
Another concept we must always consider in interpreting all test scores is the “error in measurement.” All tests have inherent error due to a multitude of factors such as student factors (e.g., motivation, health, stress) and test factors (e.g., unreliability of the test items, poorly designed items). If one could eliminate all error (which, by the way, is impossible) we would obtain the “true score.” Let’s consider the example below in the interpretation of percentile ranks and this error in measurement:
If a 3rd grader obtains the national average scaled score on the NWEA Measures of Academic Progress (MAP) math test based on the fall 2015 norms they will have a score of 190.4, which places the student at the 50th percentile rank. The error in measurement for this test, which is calculated by the test publisher, is plus or minus about 3.5 points. Therefore, we can say that the students’ “true” score will lie between 186.9 and 193.9 (190.4-3.5= 186.9, 190.4+3.5=193.9).
If we assign the appropriate percentile ranks to these score ranges you would find that the percentile rank range for this student (when just considering the error in measurement) is between the 41st and 60th percentile rank, a range of 19 percentile ranks simply based on the inherent error in measurement. You can easily see that random variation in testing can cause a potential wide swing in percentile ranks. We could test students on one day and they could get a 41st percentile rank, and the very next day, they could conceivably perform at the 60th percentile rank when there is no actual difference in student abilities. This would definitely concern a teacher and parent alike if such a scenario emerged.
This problem can be even more underscored when you compare the percentile ranks of two different tests. Since the two tests have different norm groups and each test has its own inherent error, the potential difference between the two tests can be even greater just based on error in measurement. In fact, it’s not unusual for the percentile ranks difference of two tests to be 40 percentile ranks and both tests be valid!
One final cautionary note is that we must be careful comparing percentile ranks scores from the fall to spring, since all test publishers use different norm groups for the fall and spring. These different norm groups often yield somewhat different percentile ranks. In fact, most state assessment teams recommends that percentile ranks on the state accountability tests never be used to measure student growth from year to year.
In summary, expect percentile ranks to vary greatly, particularly for students that perform in the average range or the middle of the normal curve. Be very careful when comparing the percentile ranks of two tests since they can and often will vary a great deal, especially with students in the average range. Although not as seemingly intuitive as percentile ranks, the scaled or standard scores of a test are always the best score to use, particularly when measuring growth of a student over time.
*****
Illuminate Education is a provider of educational technology and services offering innovative data, assessment and student information solutions. Serving K-12 schools, our cloud-based software and services currently assist more than 1,600 school districts in promoting student achievement and success.
Ready to discover your one-stop shop for your district’s educational needs? Let’s talk.

I gather information about Percentile ranks for my bachelor’s paper. Would you mind adding you to the list of the references? Contact me on https://highschoolgems.com.