

 Illuminate Blog
Interpreting Progress Monitoring Data
By: Holly Windram, Ph.D.., NCSP
Introduction
At this point in the school year, interventions have been happening for about 4-6 weeks and progress monitoring data have been collected per the intervention plan or per IEP goals. School staff are ready to look at progress monitoring graphs and reports, and put data-based decision-making into practice. This week’s blog provides guidance on both the science and the art behind interpreting progress monitoring data.
Know How to Read the Progress Monitoring Graph and Report
Before data can be interpreted, one has to understand the data and the report. FastBridge Learning has several excellent resources that summarize how to interpret the resulting progress monitoring graph and data report. A review of a Knowledge Base resources called Progress Monitoring Graph and Table and Progress Monitoring Report – Detail provide specific guidance, and are re-posted here.
Below is an example of a Progress Monitoring Graph. This example is for CBMreading although all FastBridge Learning measures are very similar to this example. The graph shows the goal line, i.e., the line that goes from the starting point to the end of the year goal, and the trend line, or the line that best fits the student’s progress monitoring data. The goal line is represented by a dotted blue line. The progress monitoring trend line is the solid blue line surrounded by the blue solid data points.
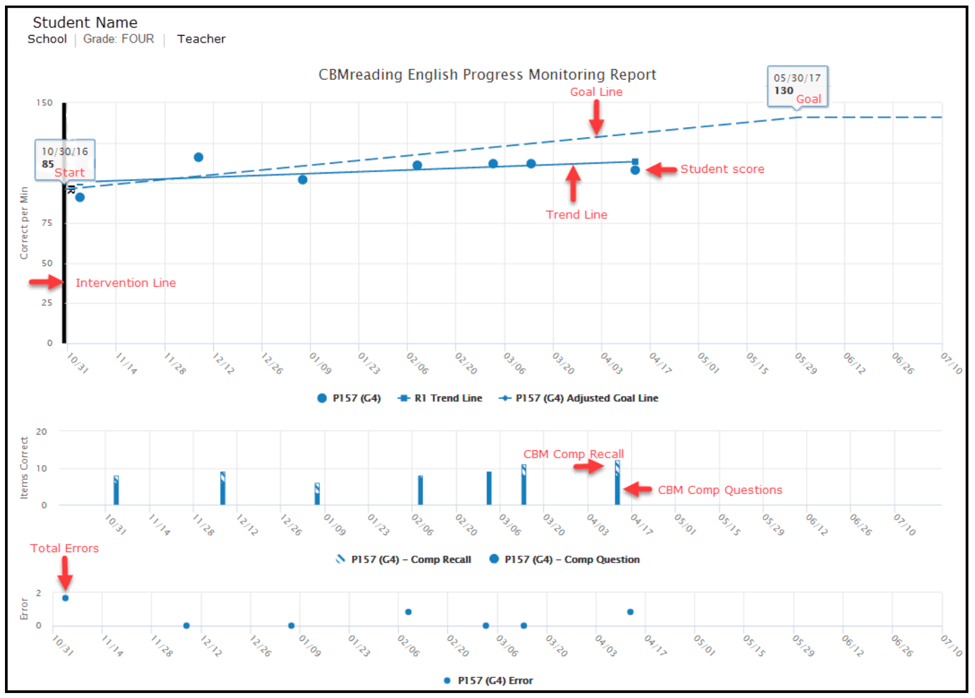
Following the graph are the specific details from each individual progress monitoring occasion. Guidance below is taken from the Progress Monitoring Report – Detail article in Knowledge Base. In the detailed report, each progress monitoring occasion begins with a header identifying the Group and Trends, followed by the actual progress monitoring scores for each week and a visual indicator of how that score compares to past performance.

Know When to Interpret the Graph Data
Research recommends that student progress monitoring graphs are reviewed once a month or every four weeks. Thus, early in the school year, this may mean a graph review occurs only after a few weekly progress monitoring data points have been collected assuming they are collected weekly. Arañas (2015) summarizes the importance of frequent progress monitoring so as to have more rather than less data to drive decision-making in a blog post from December 2015:
When it comes to frequency, progress monitoring should occur at least weekly or biweekly (Fuchs & Fuchs, 2006). In terms of duration, more than six weeks of progress monitoring was necessary to guide educational decisions (Thornblad and Christ, 2014). Regardless of how frequently and how long you are able to monitor students’ progress, it is important to understand that as much data as possible should be collected to obtain the most accurate estimate of their growth. This is especially crucial for students who are critically low.
Given that we recommend the first data review occurring within the first month and just the first few data points, what can these initial few data points tell you? From a measurement standpoint, not much. There are not enough data points to make any reliable decisions about the overall effectiveness of the intervention’s impact on overall student learning since we just don’t have enough data points yet. However, regarding fidelity, these data can tell us some important information. We can notice right away whether the data are actually being collected per the intervention plan (weekly or biweekly). Did progress monitoring start the week and day as planned? Is there at least one data point per week as planned? If not, the team should review if there are logistical challenges interfering with the progress monitoring plan, e.g., the original staff person assigned is now not available for collecting the data, or the student’s schedule got changed or instruction takes longer than anticipated and new time must be found.
Next, are the initial data points at, above, or below the goal line? If three or more are above, the team should keep an eye on the next couple of weeks’ data as the goal may not be ambitious enough. If the data are at the goal line, the team has some early confidence that the instructional match to student need and fidelity of implementation is good, and the intervention should continue. If the data points are below the goal line, the team may consider double-checking problem analysis – is there continued confidence, the right hypothesis, and the resulting intervention was chosen? Then, what will happen most often, is to give the intervention more time. While FastBridge Learning progress monitoring data are sensitive to growth in student learning, making changes to instruction too soon will make it difficult to determine whether a particular intervention is effectively targeting the student’s needs.
So, why even review the data in the first month? Why not just wait for eight weeks to do the first progress monitoring data review? Consider this an opportunity for check on fidelity. If there is an issue with the intervention or progress monitoring plan being implemented as designed, we want to know sooner not later. Best practice suggests a direct observation using a checklist followed by performance feedback should be conducted for both the intervention and progress monitoring as soon as intervention implementation has started, e.g., within the first two to three days of implementation in order to document fidelity. Assuming that occurs, the first monthly data review serves as a secondary back-up to “catch” any logistical issues that may be occurring early on so time is not unnecessarily wasted on something that isn’t happening as planned or clearly isn’t working. Monthly data reviews are also a good habit to begin right away in the school year to become part of the regular instructional routine.
Know How to Interpret Progress Monitoring Data
Once there are at least eight weeks of data, the following process can be applied for interpreting the progress monitoring graph. These steps are adapted from FAST Action: Use Your Progress Monitoring Data, and Using Progress Monitoring Data to Make Instructional Decisions (Arañas, 2015).
- Examine accuracy.
-Is it less than 95%? Consider accuracy intervention for these students.
The FastBridge Learning individual progress monitoring report provides the percentage of items that a student answered correctly. If a student is getting fewer than 95% of the items correct, an intervention targeting accuracy should be implemented. Below is an example of accuracy data, where a downward triangle indicates the times in which the student had less than 95% accuracy on CBMreading progress monitoring probes (Arañas, 2015).

- Examine the Trend Line.
-Is the line increasing, decreasing, or flat?
If the trend line is increasing, this means the student is making some improvement. If it is flat, the student hasn’t made much gain from the start to the latest progress monitoring date. If it is decreasing, the student’s performance is actually getting worse.
- Then, examine the Trend Line as compared to the Goal Line.
-Is the trend line falling below the goal line? If yes, consider increasing intensity of intervention, or changing it.
- Examine the last three data points.
-Are they above the goal line? Continue the current instruction, increase the goal
-Are they below the goal line? Intensify instruction, keep the current goal
-Are the ‘hugging’ the goal line? Maintain current instruction and goal
- Using the above information, decide if the student has met the goal. If yes, consider discontinuing the intervention.
Conclusion
Interpreting progress monitoring data is both an art and a science of educational practice that requires knowing how to read the data reports, knowing when to read them, and knowing what can be interpreted based on the data that are present. Accurate interpretation requires a good mix of the quantitative data and then knowing all other contextual variables that are influencing the data that wouldn’t show up on a graph or a report (e.g., fidelity of implementation). In the end, student outcomes are the result of the process of how we apply decision-making practices based on the data.
Additional Tools in FastBridge Learning for Interpreting Progress Monitoring Data
How is the Trend Line in the Progress Graph Determined?
Ask the Experts – How to Set and Adjust Progress Monitoring Goals – Dr. Ted Christ (11/17/2016)
The Good, Bad, and Ugly of Progress Monitoring: What Do Best Practices Say? Dr. Ted Christ (10/22/15)
Seth Aldrich (2017, April 18). Universal Screening and Progress Monitoring Using FastBridge Social, Emotional, Behavioral (SEB) Measures. [Blog Post]. Retrieved from https://www.illuminateed.com/blog/2016/03/standardize-for-effective-universal-screening-measures/
References
Arañas, Y. (2015, December 16). Progress Monitoring Basics. [Blog post]. Retrieved from https://www.illuminateed.com/blog/2021/02/what-is-progress-monitoring/
Arañas, Y. (2015, December 21). Using Progress Monitoring Data to Make Instructional Decisions. [Blog Post]. Retrieved from https://www.illuminateed.com/blog/2021/02/what-is-progress-monitoring/
Fuchs, D. & Fuchs, L.S. (2005). Responsiveness-to-intervention: A blueprint for practitioners, policymakers, and parents. Teaching Exceptional Children, 4, 93-99.
Thornblad, S.C., & Christ, T.J. (2014). Curriculum-based measurement of reading: Is 6 weeks of daily progress monitoring enough? School Psychology Review, 19-29.
