Group Screening Report for Teachers
by Rachel Brown, Ph.D., NCSP
Understanding the difference between benchmarks and norms in Group Screening Reports
The first FastBridge® report that most teachers use is the Group Screening Report. This report is designed to summarize students’ scores from universal screening assessments. Universal screening includes testing all students with the same assessment at one or more selected times during the school year in order to learn which students are on track to reach the end-of-year learning goals and which ones need additional instruction. Sometimes, universal screening is also known as “benchmark” screening because students’ scores are compared to specific score goals known as benchmarks. Benchmark scores are used as predictors of later student performance. In addition, FAST™ scores can be compared to several types of norms.
This blog will explain the differences between benchmarks and norms in relation to the Group Screening Report. In addition, it will review how teachers can use this report for instructional decisions.
Group Screening Report Features
The Group Screening Report is found in the Reporting section of the FastBridge® website. Select Reporting and then the name of the FAST™ assessment scores to view.
Next, a submenu will appear where you will confirm your selection by choosing the assessment, teacher or grade and screening interval (e.g., fall, winter, or spring). Then, select Generate Report. The report will then appear on the screen.
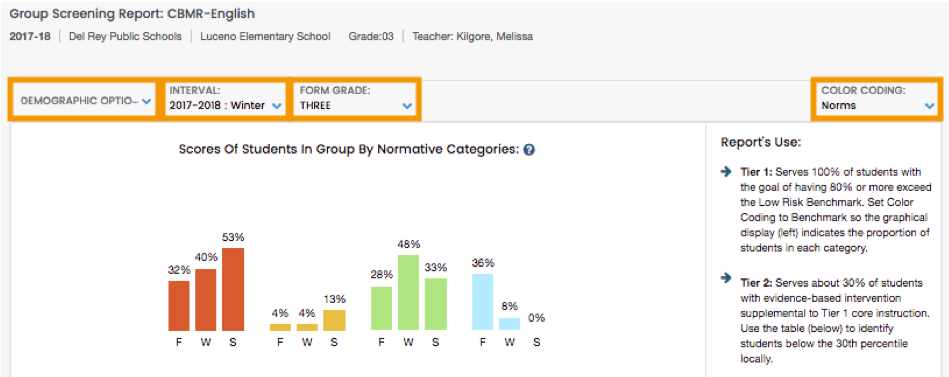
The Group Screening Report has three main sections and there are additional user choices at the top of the report, including demographic options, interval, form grade, and color coding.

Use the down arrow next to each option to change the settings. Here is a view of the demographic options. Note that in order to sort your students’ demographic, the roster uploaded into the FastBridge® system must include these details.

In the above example, the selected Interval is the winter screening period (e.g., December or January). The default Form Grade is the students’ enrolled grade level. If the students completed screening with forms from another grade level, those scores can be viewed by selecting the correct level. The Color Coding menu includes options for Norms or Benchmarks. The Norms view is the default and uses primary colors according to the legend under the students’ scores. The above example shows the top of the report with the Norms colors. Here is an example of the Benchmark colors which include shades of pink and purple.


A legend that defines each color appears below the list of students’ scores. Note that if fewer than 70% of students in a specific local group (e.g., the class, school, or district) have completed the assessment, the norms for that group will not appear. The default view is the Norms color coding and a feature of this selection is that it will display each student’s benchmark level and norms group (see below).
Infographic. The top section of the Group Screening Report shows a bar graph with the percentages of students in each of the norms or benchmark groups. In the example below, the percentages of students scoring at the high end, or in the advanced level, went down from fall to spring. This section of the report also includes information about the report’s intended use for organizing instruction at the Tier 1 (core) and Tier 2 (supplemental) levels. This information can assist teachers in reviewing their Tier 1 core instruction and identifying whether changes are needed. In the following example, the core instruction does not seem to be effective for most students so changes are recommended.

Student scores. The middle section of the report includes a listing of all students in the class and their scores collected so far on Fall, Winter, and Spring screening with the selected measure. The report will display as many scores as have been collected to that point. For example, the following list includes the Winter norms view as well as scores for those students who had completed the spring screening. The symbols next to each score indicate whether the score suggests that the student’s score is advanced, or at low, some, or high risk of not meeting an end-of-year learning goal.

Stars indicate advanced performance, no marker indicates low risk, one exclamation mark indicates some risk, and two exclamation marks indicate high risk. Notice that the color coding of the norms varies by column. This is because the student’s ranking in each column is based on where the score fell in relation to all the other students in each group. So Haley Jewkes’ score was at the 38th percentile rank compared to the other students in her class (e.g., group), but at the 36th percentile when compared to other students in her school and district, and at the 17th percentile compared to the national norms. Also notice that a student might be coded as high risk even though the local normative score is color-coded green and in the “average” range compared to other local students. This is because the benchmarks compare student performance to a fixed standard and the norms are relative rankings. 
Summary data. Under the student scores is a summary of the data above, including the average and median (i.e., middle) scores, the standard deviation, and the lowest (min) and highest (max) scores for the group.
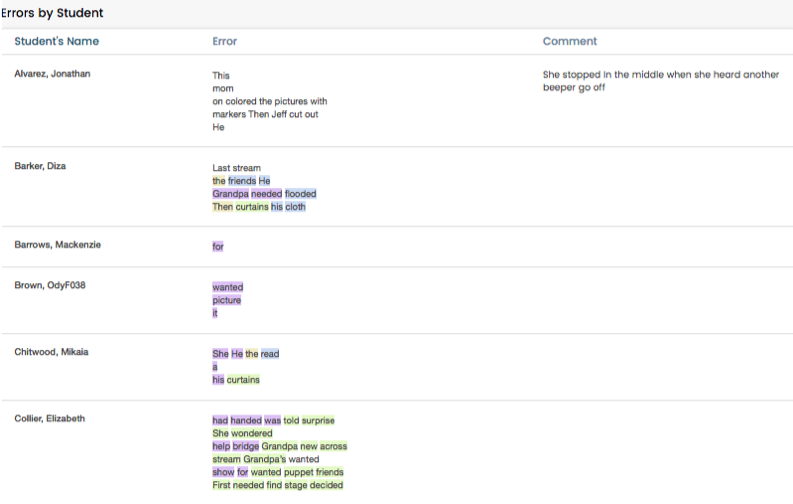
Student errors. The final section of the report includes a listing of the actual errors that the student made, if they are available for the measure. Note that this feature is not available for all FASTTM assessments. Here is an example of a partial list for CBMreading. The color codes correspond to optional error type coding that is available with the online scoring of CBMreading. The code key appears at the end of the list of students.

![]()
The specific errors each student made are shown. In addition, if the teacher entered a comment about the student, that will appear in the Comments column. The error listing can be helpful for teachers to see patterns across students that indicate a need for whole-class Tier 1 instruction. In addition, the errors can reveal student-specific learning needs that could be addressed through intervention.
Understanding Student Scores
The primary purpose of the Group Screening Report is to show trends in all students’ skills and learn whether, and what type of, changes to core instruction are needed. Using the Group Screening Report to understand the effects of core instruction is important because in order for all students to make progress, core instruction must be highly effective. Core instruction is considered effective when 80% or more of students meet the learning target (i.e., benchmark) for a screening period. In the example above, far less than 80% of students met the goal. Therefore, immediate changes to core instruction are recommended. Even when screening scores indicate that core instruction must be changed, there might be some students in a class whose current performance and skills is so different from classmates that additional intervention is also needed. When a student’s current skills are very low and different from others in the class, providing supplemental intervention is recommended because such students are likely to need more than revised core instruction in order to make progress.
The FastBridge Group Screening Report is designed to be a teacher’s first step in understanding student learning needs. This report is available as soon as a screening period ends and will show student scores immediately after screening each student. The national norms appear even before all students are screened and local norms display once 70% or more of students complete each screening. There are both Norms and Benchmark color coding options, however, the Norms view displays both Benchmark indicators and percentile rankings so is a convenient way to examine student performance in different ways. This report helps teachers learn how effective core instruction is and whether changes are needed. In addition, it can be used to identify a small number of students who might need additional intervention.

