

 Illuminate Blog
How to Set Academic Progress Monitoring Goals
There are several ways of setting goals for students when progress monitoring, one of the essential components in a multi-tiered system of supports (MTSS).
The ways in which goals are set should be aligned with the questions they address.
In this guide, we will cover how to set academic progress monitoring goals and the importance of doing so.
Table of Contents
- Why Is it Important to Set Academic Progress Monitoring Goals?
- How FastBridge Helps Set Academic Progress Monitoring Goals
- Other Considerations When Considering Progress Monitoring Goals
Why Is it Important to Set Academic Progress Monitoring Goals?
Setting student-specific progress monitoring goals is an essential component of a Multi-Tiered System of Supports (MTSS).
But just as essential as goal setting is setting goals that are at once ambitious and realistic. If goals are too ambitious, students are unlikely to succeed; set the bar too low and students are not challenged to their full potential, impeding their progress.
How to Set Academic Progress Monitoring Goals With FastBridge
To assist in optimal goal setting, the FastBridge system provides norms-based and criterion-based information about student scores.
That information in turn provides educators with three key types of goal setting for their students: norm-referenced goals, criterion-referenced goals and rate of improvement goals. Each type of goal provides a different path to student success, so additional thought is required when deciding when users might select each type for student goal-setting.
Norm-Referenced Goals
Norms are created by putting all the scores from a specific group of students in order from lowest to highest and then showing each student’s percentile ranking compared to the other students in the same group.
FastBridge provides up to four different types of normative comparisons for most assessments.
- Group (class)
- School
- District
- National
It is important to note that the student’s score will remain the same across all four norms, but the student’s ranking might change across the groups.
This is because different students are included in each group. When more or fewer students are included in the group, the student’s rank order and percentile ranking could change. Here is an example from a CBMreading score report.
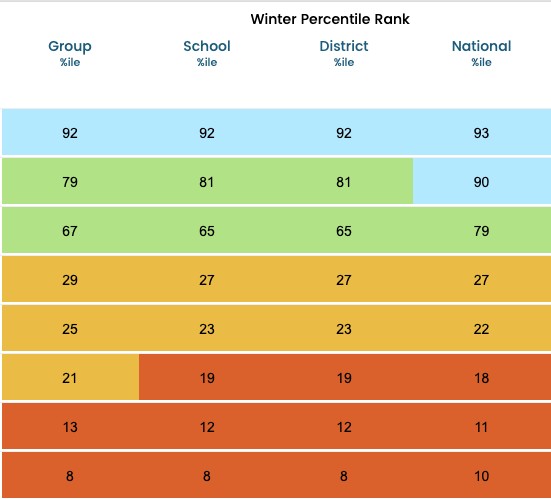
The number shown is the percentile ranking and not the student’s score. In this example, two students’ scores were different across the groupings.
The Group, School and District norms are types of local norms because they reflect comparisons with other students who are participating in the same curriculum. Norms can be helpful for goal setting because they can show how different a student’s performance is from peers in the same class or school.
For example, we might set a norm-referenced goal for the student to perform at the 30th percentile compared to national or local end-of-year (spring) norms. FAST scores between the 30th and 85th percentiles are indicated by green color coding.
One problem with norm-referenced goals is that performance at the 30th percentile might not be enough to be successful. Also, some norm-referenced goals correspond with insufficient long-term growth when we look at norms for rates of improvement (ROIs, which will be explained below).
For example, a student performing at the 25th percentile in the fall, who achieves a 30th percentile score by spring, may have made weak growth considering ROI norms. Importantly, this student would be considered “At-Risk” if compared to a criterion goal.
Criterion-Referenced Goals
A criterion-referenced goal is one that is set to a specific predetermined level or criterion. Criterion-referenced goals are created by selecting scores that are highly predictive of student success on other tests like state assessments. Such goals are designed to help a student reach a proficient level of skills on the other assessment.
In FastBridge, students whose scores suggest that they will be proficient on the later test are referred to as “Low-Risk.” This means they are at a low risk of not reaching the goal. In comparison, students whose scores are below the proficiency criterion are coded as being either “Some-Risk” or “High-Risk.”
Scores that indicate “Some-Risk” are indicated with one exclamation mark (!), and those at “High-Risk” have two exclamation marks (!!). Scores that are “Low-Risk” do not have any indicator. Scores indicating advanced skills have an accompanying white star. Here are examples for CBMreading scores:
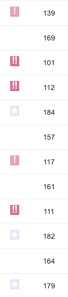
The criteria for FastBridge risk levels were set by researchers based on findings from prior research indicating what ranges of FastBridge scores are associated with low, middle and high scores on state assessments.
The FastBridge risk levels actually use national norms to identify performance levels and then provide a specific criterion score for each level.
- Advanced = Scores above the 70th national percentile
- Low-Risk = Scores from the 40th to 70th percentiles
- Some-Risk = Scores from the 15th to 40th percentiles
- High-Risk = Scores below the 15th percentile
Criterion-referenced goals can provide educators with important information about how far away from grade-level proficiency a student is. Although criterion-based goals have the benefit of trying to help the student reach his or her grade-level skills, they also can be too difficult to reach in the current school year.
An example of an overly ambitious criterion-referenced goal might be if we were to expect a second grade student to go from a “High-Risk” CBMreading score in the fall (e.g., 23 words read correctly), to a “Low-Risk” score in the spring (e.g., 106). That student would have to gain 2.3 words per week to achieve that goal (106 goal, minus 23 baseline, divided by 36 instructional weeks from fall to spring, equals 2.3 words per week). When we look at norms for growth rates, this would be well above the 95th percentile — a rate few students ever achieve.
Rate of Improvement (ROI) Goals
Another alternative is to use ROI goals. With these, educators can set goals in which students “catch up” to their peers, although sometimes over a longer period of time. To achieve a reasonable but ambitious “catch-up” goal, a student must improve at a rate stronger than his or her peers.
The analogy might be a cross country runner who is behind the average runners and progressing more slowly. The runner will need to accelerate to catch up to the group that is ahead and running faster.
Educators must be careful, however, that the goals set for students are not so ambitious that few students would ever achieve them.
Here is the ROI table for FAST CBMreading grade 3.
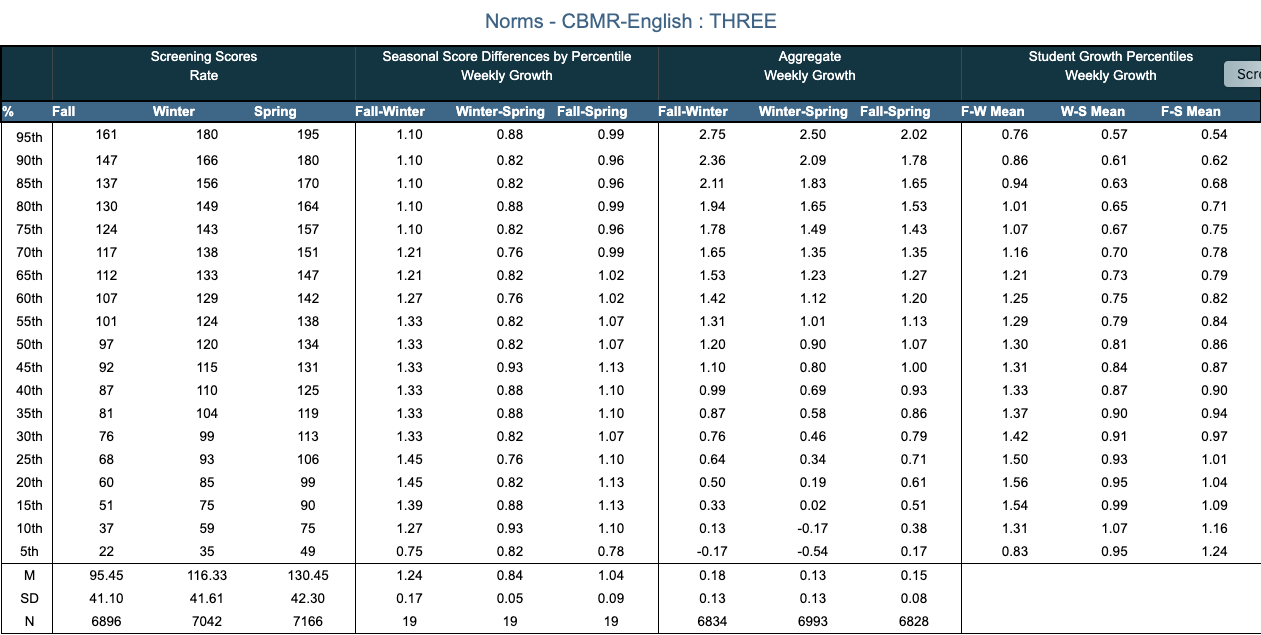
Understanding typical and realistic ROIs is very helpful when setting student goals. For students receiving effective core instruction and additional targeted, evidence-based intervention, the expectation is that they will make stronger than average growth.
The average fall to spring growth at the 50th percentile for third graders, according to the aggregate weekly growth columns, is 1.07 words gained per week. Based on this, a reasonable and ambitious growth rate might be a 75th percentile ROI. That is somewhere between average (50th percentile) and rarely ever achieved (99th percentile). For third graders, this would be to gain 1.43 words per week. Whether or not a weekly goal set at the 75th percentile corresponds to either the norms or benchmarks, it’s most likely feasible for the student to make that amount of growth.
FastBridge progress monitoring is set up to include default weekly goals that reflect realistic and ambitious growth for students. For example, for CBMreading the default rate of improvement in the progress monitoring set-up menu is 1.5 words per week growth. If students achieve 1.5 words per week in grades 1-3, they will make growth somewhere near the 75th percentile (see table above).
That is, their ROIs would be stronger than the average student in their grade, but the goal rate is not so ambitious that few students would ever achieve it. The careful observer will see that the default goal of 1.5 words per week is sometimes above or below the 75th percentile, depending on the grade level.
Educators can adjust the growth rate for an individual student based on the actual 75th percentile for that grade and measure, or based on the intensity of the intervention provided.
Other Considerations When Setting Progress Monitoring Goals
One advantage of rate of improvement goals is that at any given time a student’s current growth can be compared to the ROI goal.
When we set norm-referenced or criterion-referenced goals, we typically identify a number at the end of the progress monitoring schedule (e.g. in the spring). The goal only makes sense on that date. We have to look at the current rate of improvement anyway, to see if the student is on a trajectory to meet that goal.
The FastBridge norms tables provide percentile rankings for rates of growth based on the national aggregate sample of scores.
Simply go to the norms tables (CBMreading for 2nd grade in this example), find the measure, grade level and identify aggregate growth that corresponds with the 75th percentile (1.63 in the example below).

Educators using the FastBridge progress monitoring system can adjust default goals (e.g., 1.5 words per week growth for CBMReading) to correspond with 75th percentile rates of improvement for a given measure and grade level for a more precise, reasonable and ambitious goal. When the weekly gain is adjusted, the corresponding end of year ‘Goal’ is also adjusted and can be compared to the ‘Benchmark’ score that indicates a low risk status.

With the advent of rate of improvement or ‘growth’ norms, educators are able to set realistic and ambitious goals based on the progress monitoring measures they are using at a particular grade. When students achieve a 75th percentile rate of improvement relative to average students at that grade, they will usually catch up. Maybe not this year, but eventually.
Rates of improvement norms provide data that may help prevent educators from setting inadequate goals that increase gaps in achievement, or overly ambitious goals that lead to bad decision-making.
References
AIMSweb ROI Growth Norms (2017, January 11). Retrieved from
https://www.illuminateed.com/wp-content/uploads/2017/01/ROI_Norm_Tables1.pdf
Fuchs,L.S., Fuchs, D., Hamlett, C. L., Walz, L. & Germann, G. (1993). Formative Evaluation of Academic Progress: How Much Growth Can We Expect? School Psychology Review, 22, pp. 27 – 48.
Seth Aldrich is a certified bilingual school psychologist, as well as a NY State licensed psychologist. He works as a school psychologist for the Homer Central School District, and also consults with school districts concerning Response to Intervention (RTI) for academic and behavioral difficulties. Seth consults with educators to utilize FastBridge as well as other RTI/MTSS assessments for data base decision-making within a tiered problem solving process. He is a consortium member with the New York State RTI Technical Assistance Center, and works primarily with English language learners (ELLs) as well as family court involved youth in his private practice. Seth’s most recent publication is the book: RTI for English Language Learners: Understanding, Differentiation and Support.
