

Supercharge Your Data-Driven Decision Making with eduCLIMBER
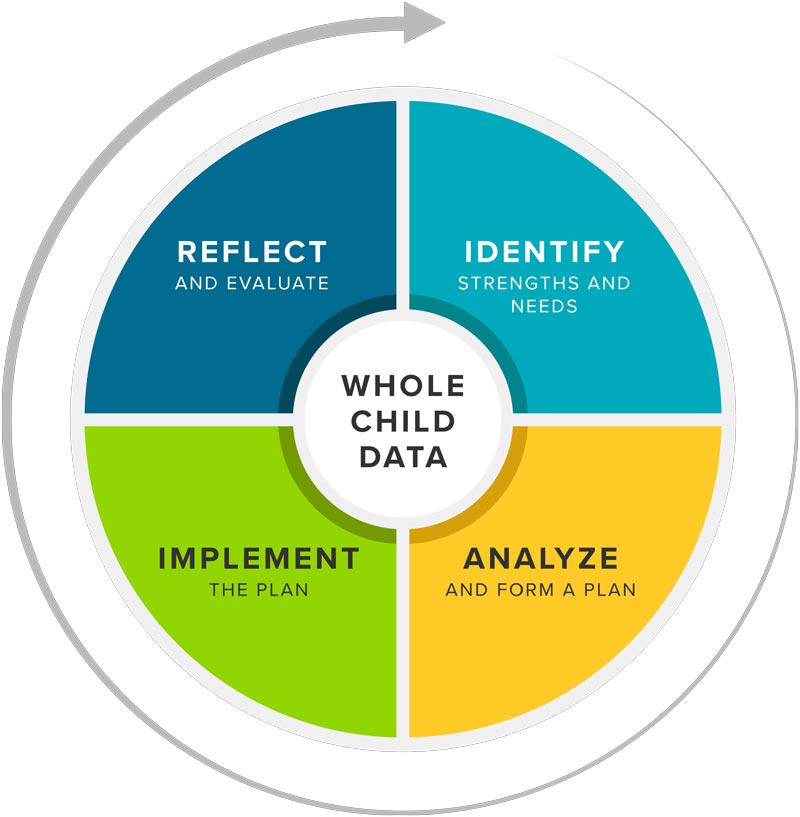
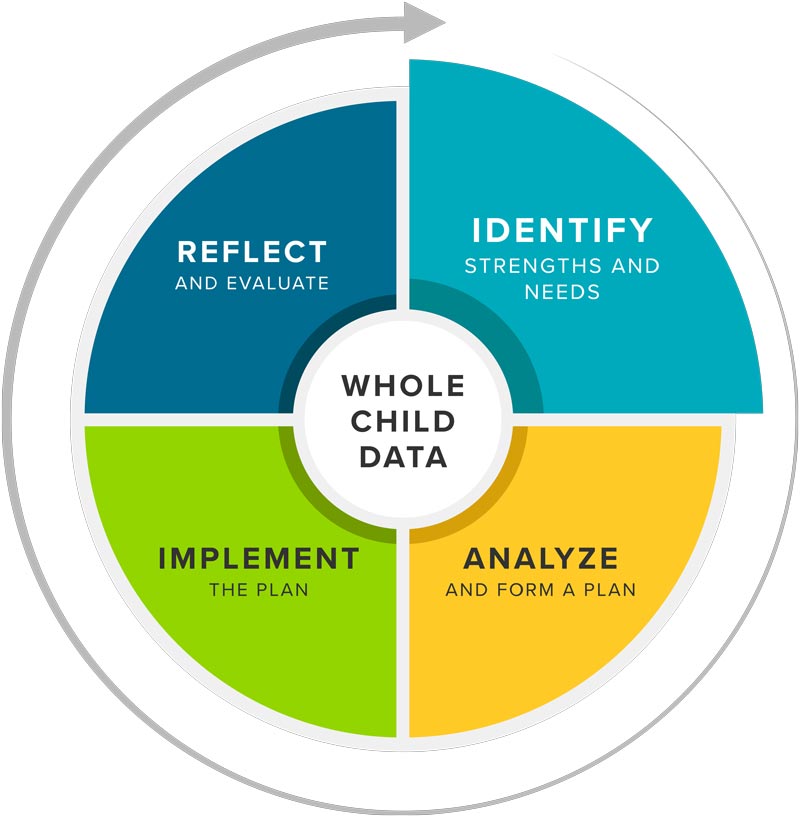
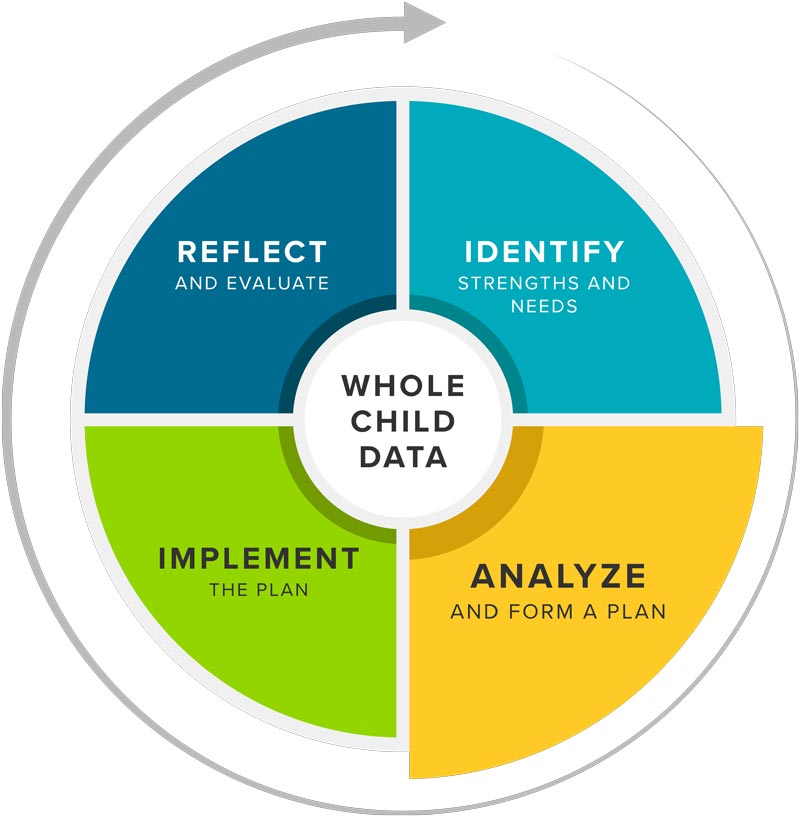
At every stage of the continuous improvement cycle, eduCLIMBER helps teams utilize whole child data to streamline essential MTSS processes, evaluate effectiveness, drive system-level improvements, and promote equitable practices. Click the graphic to learn more.


Are our students performing at grade level or higher?
How have they performed in the past?
Getting Started:
Charts are interactive graphs that immediately populate after academic, social-emotional behavior (SEB), attendance, and behavior incident data are added. Use charts to answer high-level questions about achievement and growth across multiple measures and years. Click into any chart to see longitudinal patterns and subskill details. Filter charts to disaggregate data by different groups of students.

Digging Deeper:
The Effectiveness Report visualizes achievement and growth between assessment periods for various measures. Explore how students are moving between risk levels or performance bands to determine where instruction and intervention are already supporting students and where additional adjustments are needed. Click the report to see which students are represented.

Which students are demonstrating a risk of not meeting learning targets?
How long have they demonstrated a risk?
Getting Started:
The Effectiveness Report visualizes changes in achievement and growth between assessment periods for various measures. Explore how students are moving between risk levels or performance bands to determine where instruction and intervention are already supporting students and where additional adjustments are needed. Click the report to see which students are represented.
Digging Deeper:
Thresholds is an early warning and alert system that provides 24/7 automated data monitoring across assessment, attendance, behavior incident, and other data. Use the interactive reporting to monitor shifts in universal, group, and individual student needs as they happen. The system emails the right users when a student crosses a threshold so they're alerted as soon as a student shows a potential need.

Are our students' outcomes equitable?
Do we see different results for different groups of students?
Getting Started:
Program Evaluation provides one-click data disaggregation by school, grade, gender, and ethnicity. Use the Program Evaluation Module to intentionally explore risk levels and proficiency for groups of students, visualize overall trends and improvement, and reveal longitudinal patterns in student outcomes. Toggle in additional filters for different groups of students, programs, or interventions to isolate and examine differences in outcomes.
Note: System administrators have the option to activate this feature for individual users. Reach out to your system administrator if you do not see it available in your account.

Digging Deeper:
Students 3D is a Dynamic Data Definer that enables teams to "slice and dice" data, reveal patterns in data outcomes, and explore areas of inequity. Dynamically disaggregate assessment, attendance, incident, and other data by gender, ethnicity, meal status, and disability code. Create and combine various filters to reveal trends across data sources that might otherwise go undetected. Define groups of students who need additional supports and visualize the students behind the data.

Are students making adequate growth over time? Which students are or are not?
Getting Started:
Longitudinal Charts help to easily explore average scores over time and the trendlines for different groups of students. Dig into patterns in achievement and growth, understand how different groups of students are growing, and identify students who need additional support to make adequate growth.

Digging Deeper:
The Effectiveness Report visualizes changes in achievement and growth between assessment periods for various measures. Explore how students are moving between risk levels or performance bands to determine where instruction and intervention are already supporting students and where additional adjustments are needed. Click the report to see which students are represented.
Are there Tier 1 needs in my class, student group, grade level, or school? What are they?
Getting Started:
Data Walls automatically pull together whole child data in spreadsheet format for effortless data triangulation at the class, group, grade, or school level. Use the default data walls or build your own to visualize data across multiple measures. Identify Tier 1 needs and support diagnostic processes and root cause analysis. Click into the report to see historic scores, group students, add an intervention group on the fly, or check an intervention's status.

Digging Deeper:
Scatterplots help educators understand the correlations between attendance, behavior incidents, and various assessments. Easily determine whether there's a correlation between two data sets to help validate or disprove hypotheses around which data are important for triangulation (e.g., Is there a relationship between students' attendance and results on a screening assessment?). Better understand which data sets provide information that drives improved student outcomes, and which data sets do not provide meaningful guidance.

What are the whole child strengths and needs for each individual student?
Getting Started:
The Student Profile shows all of a student's whole child data in one place for both current and past years. Explore academic, social-emotional behavior (SEB), attendance, behavior incident, intervention, and qualitative data to get a full picture of learning and needs for each student.
Digging Deeper:
The Student Profile is also interactive. Click into any data point to examine longitudinal data and explore past instruction and intervention strategies (and their effectiveness) to inform root cause analysis and determine the right next step for each learner.

How can we collaborate to analyze data and pinpoint Tier 1, group, or individual student needs?
Getting Started:
Collections help data teams "pin" charts, data walls, and key documents together to easily access or share. Quickly pull up all the right data for your meeting or data conversation. Easily monitor key data and different groups of students throughout the year, without having to recreate reports or navigate to multiple places throughout the system. The pinned charts and data walls are automatically updated in real-time as new data are added.

Digging Deeper:
The Meetings Module is a built-in collaboration interface designed to help remote or onsite data teams efficiently make data-driven decisions. The interface pulls up a selected list of students along with their academic/SEB data, progress monitoring, intervention data, and student plans in one place. Reference agendas, take notes, and assign action items from the module. Spend more time talking about student needs and less time searching for student data.

How can we collaborate to develop a plan for addressing the need?
Getting Started:
The Meetings Module is a built-in collaboration interface designed to help remote or onsite data teams efficiently make data-driven decisions. The interface pulls up a selected list of students along with their academic/SEB data, progress monitoring, intervention data, and student plans in one place. Reference agendas, take notes, and assign action items from the module. Spend more time talking about student needs and making decisions and less time searching for student data.
Digging Deeper:
smartFORMs are customizable templates that can be used as student plans (e.g., intervention, 504, English learner), for data team agendas, and more. Student data can be pulled directly into student plan smartFORMs. Assign action items and easily share access to the smartFORM with the right stakeholders. Create a custom smartFORM or download a template from the climberCLOUD.

How can we create and manage academic interventions?
Getting Started:
Tags can be created and applied for any group of students (e.g., interventions, concerns, programs). Tags display on student profiles and data walls so stakeholders get a full picture of what's happening with each student. Tags can also be used as filters to disaggregate and analyze proficiency, risk, growth, and other data for that specific group.

Digging Deeper:
The Interventions Module is a one-stop hub for entering, monitoring, and evaluating the effectiveness of academic, SEB, attendance, and other interventions. Add interventions for groups and individual students directly to the system, where the interventions live alongside the rest of the students' whole child data and connect to built-in fidelity and effectiveness reporting tools.

How can we create and manage social-emotional behavior (SEB) interventions?
Getting Started:
Tags can be created and applied for any group of students (e.g., interventions, concerns, programs). Tags display on student profiles and data walls so stakeholders get a full picture of what's happening with each student. Tags can also be used as filters to disaggregate and analyze proficiency, risk, growth, and other data for that specific group.
Digging Deeper:
The Interventions Module is a one-stop hub for entering, monitoring, and evaluating the effectiveness of academic, SEB, attendance, and other interventions. Add interventions for groups and individual students directly to the system, where the interventions live alongside the rest of the students' whole child data and connect to built-in fidelity and effectiveness reporting tools.

How can we assign and manage action steps and goals?
Getting Started:
Action Items can be created and assigned to users directly within the system. They serve as a user-friendly to-do list and a way for teams to monitor progress across various tasks. Users who are assigned a task receive an automated email notification, including the due date. When tasks are completed, the assigner is notified in order to keep communication and workflows moving.

Digging Deeper:
Student Learning Objectives (SLOs) help educators create assessment or behavior incident goals and action plans at the district, school, grade, class, or student group level. Use the interface to set your data-based goal, the date the goal will be completed, logistics needed for your plan, and the strategies you'll use to meet your goal. Use the summary page to track progress on action steps, to add journal entries, and to report your results.

Are we doing what we said we would in terms of Tier 1 intensifications, professional development, school improvement goals, and other initiatives?
Getting Started:
Actions Items can be created and assigned to users directly within the system. Action items are a user-friendly to-do list and a way for teams to monitor progress across various tasks. Users who are assigned a task receive an automated email notification, including the due date. When tasks are completed, the assigner is notified in order to keep communication and workflows moving.
Digging Deeper:
Student Learning Objectives (SLOs) help educators create assessment or behavior incident goals and action plans at the district, school, grade, class, or student group level. Use the interface to set your data-based goal, the date the goal will be completed, logistics needed for your plan, and the strategies you'll use to meet your goal. Use the summary page to track progress on action steps, to add journal entries, and to report your results.
Are interventions being implemented with fidelity?
Getting Started:
The Interventions Module provides built-in tools to record intervention fidelity data, including procedures, duration, participation, and engagement for individual students and intervention groups. Click to check automated or imported progress monitoring data or intervention fidelity at any time. Users can also set up automated fidelity reports.

Digging Deeper:
The Interventions Module also calculates and aggregates fidelity data by student, school, intervention strategy, and more. See aggregated data or click into groups or individual student records to see more detail. Identify fidelity issues as soon as they start and gain key insights into whether certain interventions are truly ineffective or simply not implemented as intended.

How can we investigate fidelity issues during implementation?
Getting Started:
The Interventions Module enables educators to click into and examine fidelity data to better understand any issues. Use the reporting to pinpoint and clear fidelity barriers caused by lack of professional development, lack of student participation, interventionist over-scheduling, and more.

Digging Deeper:
The Interventions Module gives one-click access to all intervention records, including student participation, rate of improvement (ROI), tier, and interventionist. Sort and filter the report to dig deeply into fidelity issues so supports can be provided where needed.

Are our Tier 1 intensifications effective? Are we meeting our professional development, school improvement, and other goals? Are additional adjustments needed?
Getting Started:
Program Evaluation provides one-click data disaggregation by school, grade, gender, and ethnicity over time. Use the Program Evaluation Module to intentionally explore risk levels and proficiency for groups of students, visualize overall trends and improvement, and reveal longitudinal patterns in student outcomes. Toggle in additional filters for different groups of students, programs, or interventions to isolate and examine differences in outcomes.
Note: System administrators have the option to activate this feature for individual users. Reach out to your system administrator if you do not see it available in your account.
Digging Deeper:
Student Learning Objectives (SLOs) help educators create assessment or behavior incident goals and action plans at the district, school, grade, class, or student group level. Use the interface to set your data-based goal, the date the goal will be completed, logistics needed for your plan, and the strategies you'll use to meet your goal. Use the summary page to track progress on action steps, to add journal entries, and to report your results.
Are students making adequate growth over time? Which students are or are not?
Getting Started:
Longitudinal Charts help to easily explore average scores over time and the trendlines for different groups of students. Dig into patterns in achievement and growth, understand how different groups of students are growing, and identify students who need additional support to make adequate growth.
Digging Deeper:
The Effectiveness Report visualizes changes in achievement and growth between assessment periods for various measures. Explore how students are moving between risk levels or performance bands to determine where instruction and intervention are already supporting students and where additional adjustments are needed. Click the report to see which students are represented.
Is a student's academic intervention effective? Should we continue, change, or fade it?
Getting Started:
The Meetings Module is a built-in collaboration interface designed to help remote or onsite data teams efficiently make data-driven decisions. The interface pulls up a selected list of students along with their imported or automated progress monitoring data, intervention data, other key data, and plan records in one place for efficient data analysis. Agendas and notes can also be appended. Use the buttons to record your decision. The student's plan is automatically updated.
Is a student's social-emotional behavior (SEB) intervention effective?
Should we continue, change, or fade it?
Getting Started:
The Meetings Module is a built-in collaboration interface designed to help remote or onsite data teams efficiently make data-driven decisions. The interface pulls up a selected list of students along with their progress monitoring data, intervention data, other key data, and plan records in one place for efficient data analysis. Agendas and notes can also be appended. Use the buttons to record your decision. The student's plan is automatically updated.

Is our overall intervention program effective? Which interventions should we scale up?
Which can we discontinue to save dollars and PD hours?
Getting Started:
The Interventions Module is a one-stop hub for entering, monitoring, and evaluating the effectiveness of academic, SEB, attendance, and other interventions. The Interventions Module calculates and provides interactive reporting on fidelity, on track status, and rate of improvement (ROI) by school, grade, intervention, interventionist, and more. Effortlessly track how many students are receiving various interventions to pinpoint issues with over-identification or under-resourcing. Identify effective interventions to expand and ineffective interventions to discontinue.
Digging Deeper:
The Interventions Module also aggregates rate of improvement (ROI) by school, grade, intervention, gender, ethnicity, and tier. Isolate effective and ineffective interventions, investigate implementation issues, and confidently make programming decisions to maximize student growth while saving dollars and PD hours. Identify successful Tier 2 or Tier 3 practices that could be implemented in Tier 1 to support the success of all students.

Are our interventions helping students catch up to grade level benchmarks?
Getting Started:
The Effectiveness Report visualizes changes in achievement and growth between assessment periods for various measures. Explore how students are moving between risk levels or performance bands to determine where instruction and intervention are already supporting students and where additional adjustments are needed. Apply filters to isolate results for specific groups of students (e.g., by intervention, by intervention status, by program).
Digging Deeper:
Students 3D is a Dynamic Data Definer that enables teams to "slice and dice" data, reveal patterns in data outcomes, and explore areas of inequity. Dynamically disaggregate assessment, attendance, incident, and other data by gender, ethnicity, meal status, and disability code. Visualize which students are (or aren't) benefiting from additional supports by examining data by intervention, by tier, and more. Create and combine various filters to reveal trends across data sources that might otherwise go undetected. Define groups of students who need additional supports and visualize the students behind the data.
Are our results equitable? Are there groups of students who are not responding to instruction or intervention?
Getting Started:
Program Evaluation provides one-click data disaggregation by school, grade, gender, and ethnicity over time. Use the Program Evaluation Module to intentionally explore risk levels and proficiency for groups of students, visualize overall trends and improvement, and reveal longitudinal patterns in student outcomes. Toggle in additional filters for different groups of students, programs, or interventions to isolate and examine differences in outcomes.
Note: System administrators have the option to activate this feature for individual users. Reach out to your system administrator if you do not see it available in your account.
Digging Deeper:
Students 3D is a Dynamic Data Definer that enables teams to "slice and dice" data, reveal patterns in data outcomes, and explore areas of inequity. Apply filters to isolate results and patterns in assessment, attendance, incident, and other data for specific groups of students (e.g., by ethnicity, by intervention, by program). Visualize which students are (or aren't) benefiting from additional supports by examining data by intervention, by tier, and more. Create and combine various filters to reveal trends across data sources that might otherwise go undetected.

Not an eduCLIMBER client?
eduCLIMBER is an MTSS collaboration and management solution providing whole child data visualizations and built-in tools for intervention tracking, effectiveness reporting, equity monitoring, and more.