

Monitor Growth, Effectiveness, and Equity Across Every Data Point
Explore interactive, longitudinal data visualizations to understand what’s working, ensure all students are succeeding, and drive change where needed.
Schedule 1:1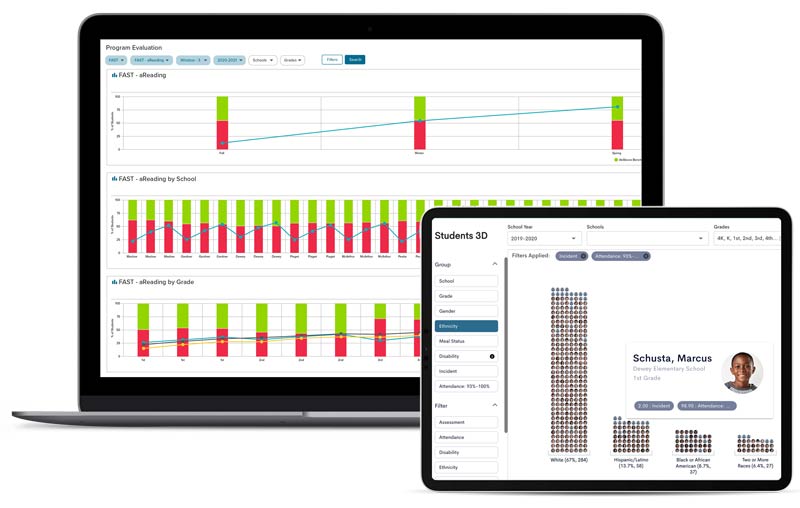
Change Trajectories with a Holistic View into Needs
Bolster school improvement and promote equity by easily triangulating all whole child data side by side, isolating patterns in growth and outcomes, creating built-in action plans based on your findings, and monitoring progress throughout the year.


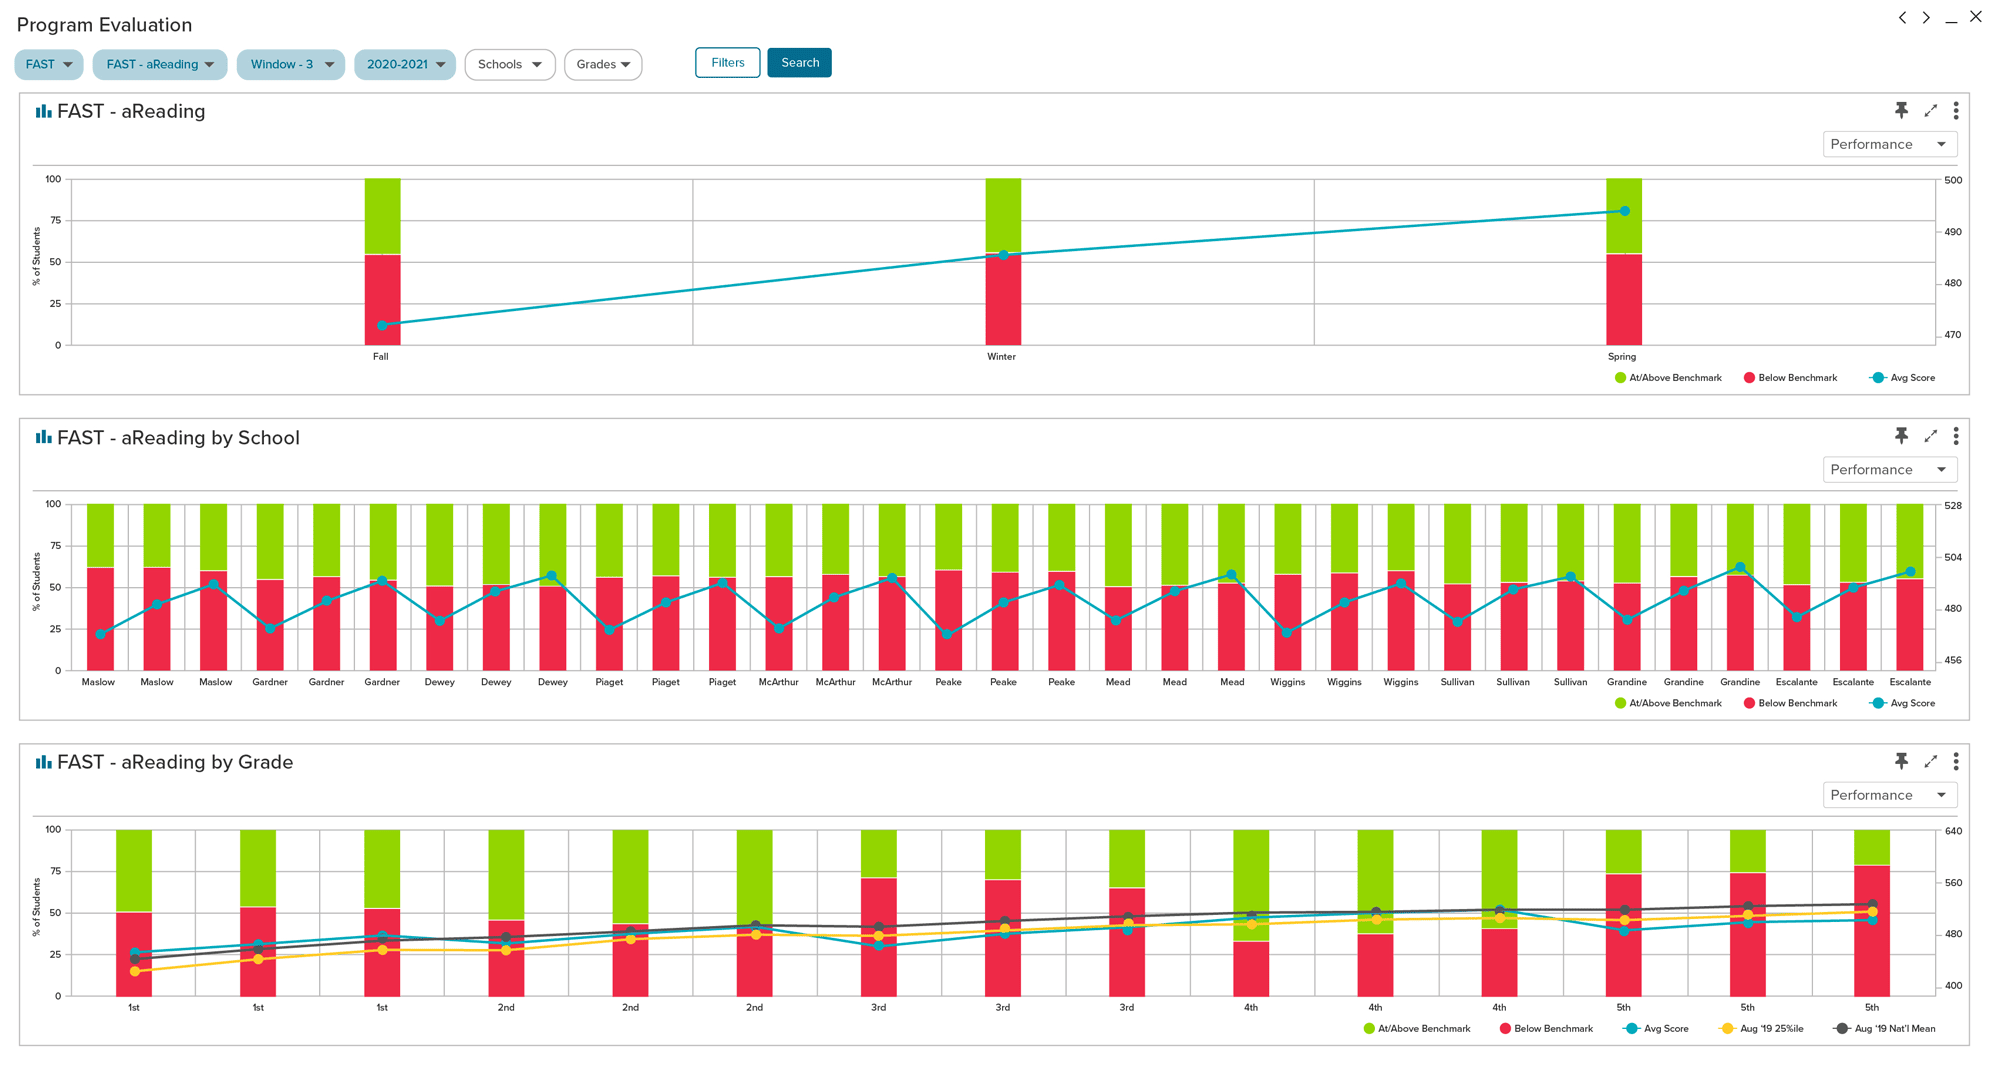
Drive Program Evaluation Decisions Across the District
Disaggregate data with one click to identify patterns in proficiency, risk, and growth, reveal trends for different groups of students, and improve outcomes for all learners.
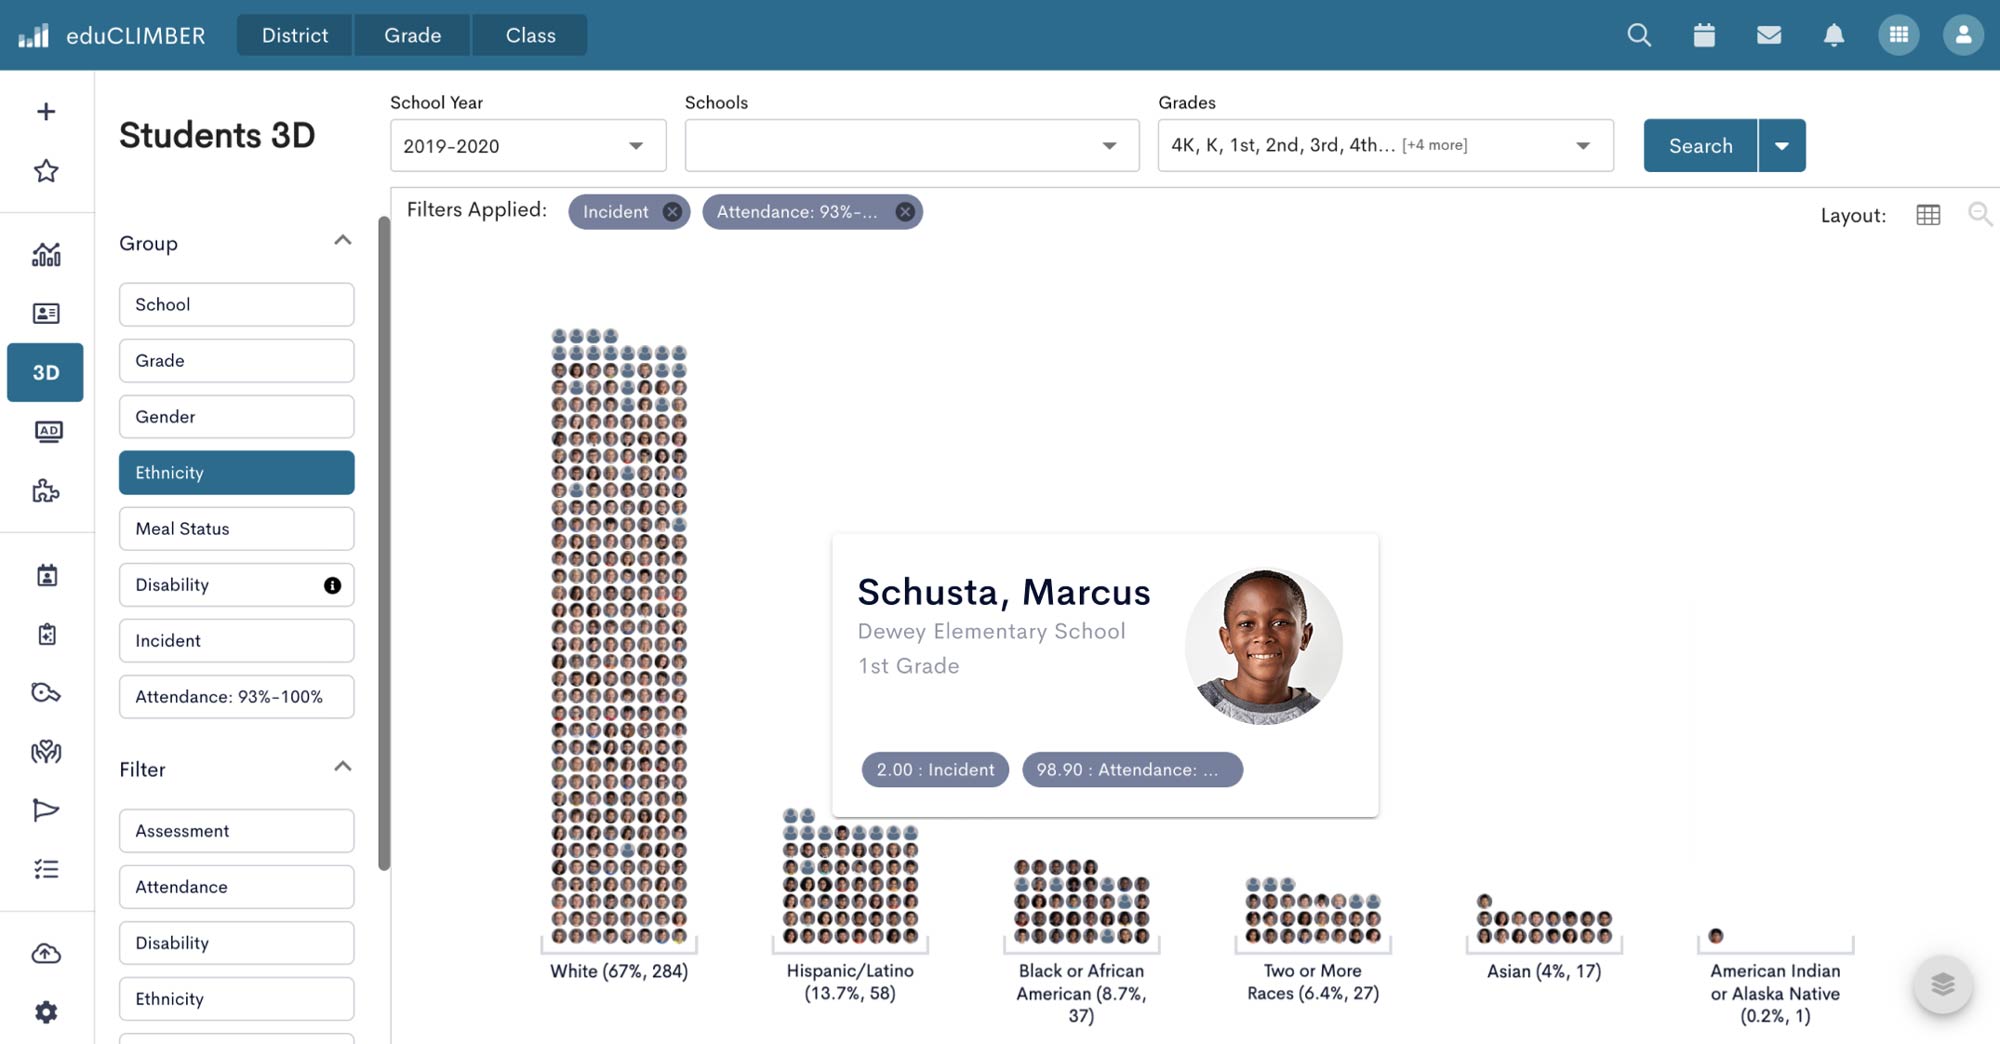
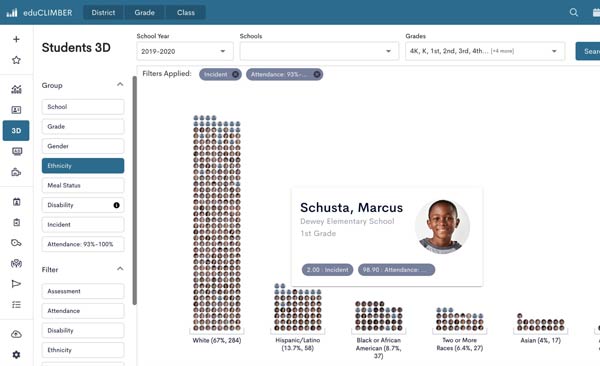
See the Students Behind the Data
Analyze whole child data through a variety of lenses to reveal inequitable or disproproportionate outcomes, highlight practices that require examination, and identify areas where professional development might be impactful.

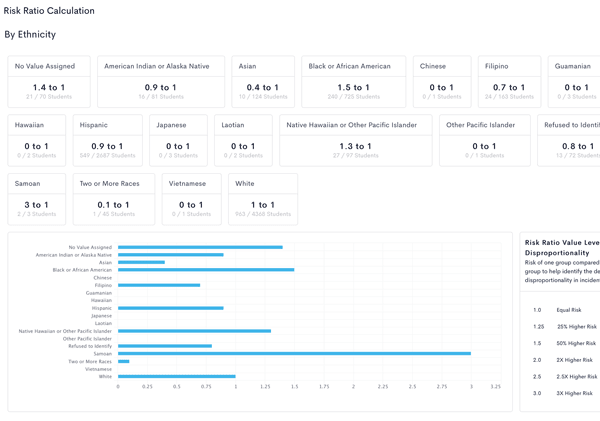
Pinpoint Areas of Disproportionality to Drive Change
Use the built-in disproportionality calculator to explore patterns in behaviors reported, administrative responses, and more to surface trends that might otherwise go undetected and isolate practices that require analysis and change.
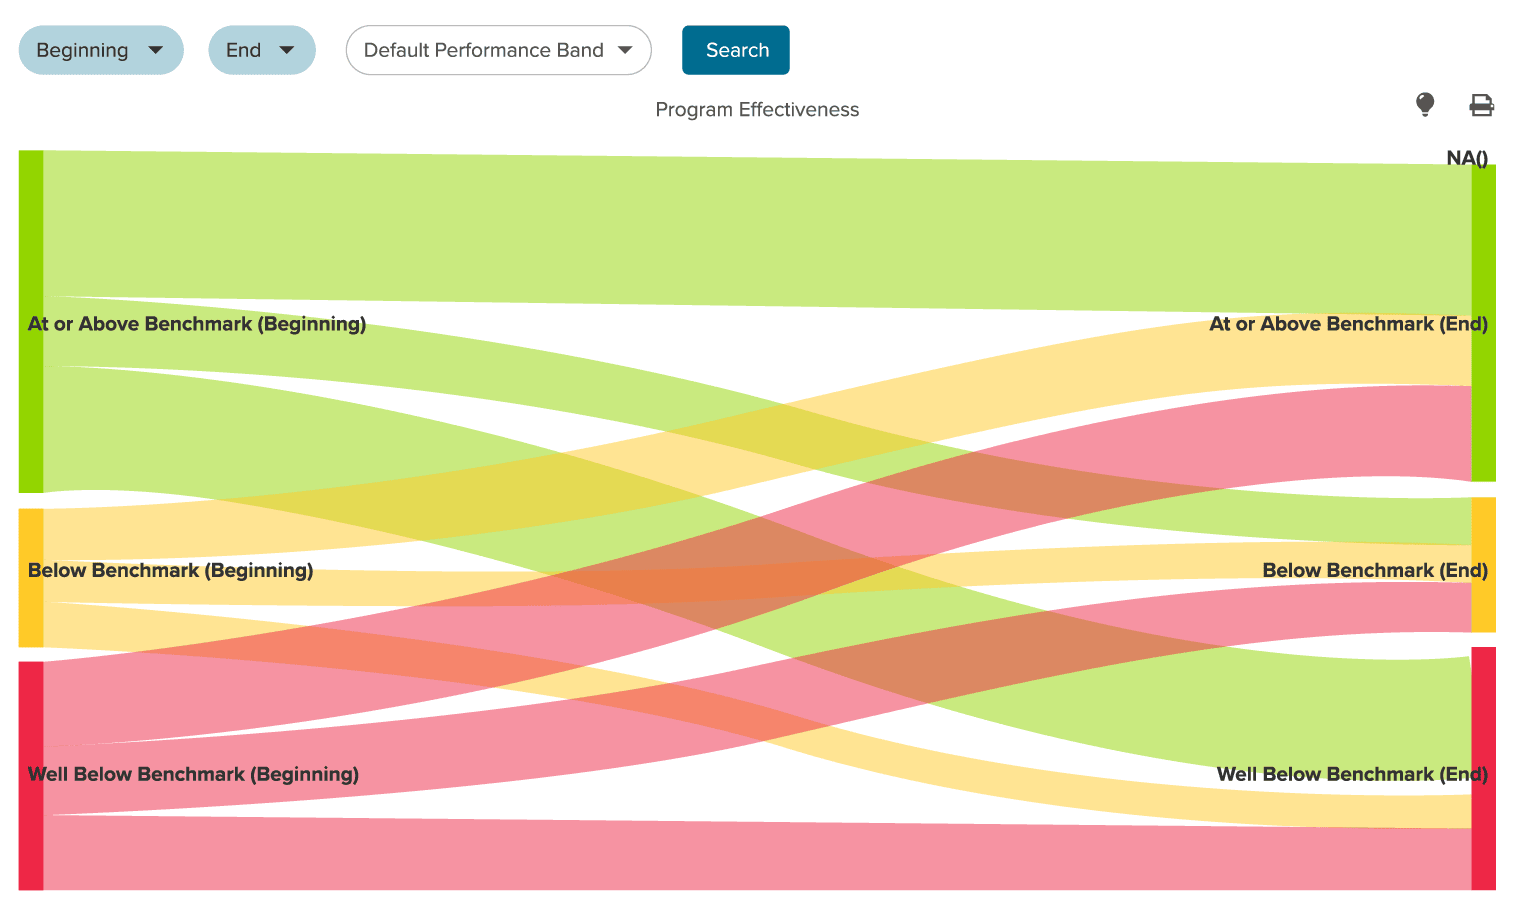
Gain Deeper Visibility into Effectiveness
Explore how students are growing over time by isolating which groups of students are increasing, decreasing, or remaining stagnant in their proficiency and risk levels.

Learn how eduCLIMBER is already supporting data-driven educators like you.

Wahoo Public Schools
An award-winning Nebraska district leverages eduCLIMBER to make strategic, data-driven decisions in their MTSS.

Wausau School District
A Wisconsin school district uses data to drive a student-centered, targeted system of supports at all levels of instruction.

Newton County School System
A large Georgia district discovers a data visualization solution that makes supporting every student a reality.
