

 Illuminate Blog
BI Tool: ACCESS “Can Do” Report
Last Month, Brian Schum from Lammersville Unified School District highlighted his “MAP Low Level Analysis Report.” Brian’s report generated a great deal of interest, and numerous Illuminate BI Tool Users have already used Brian’s report as a jumping off point to create their own version of the report. If you missed it, you can read all about it here.
Similarly, we’ve seen a number of BI Tool users create their own version of Salt Lake City School’s Cumulative Assessment Report. It’s promising to see BI Tool Users, multiple states and time zones away, inspiring and helping each other. Allowing BI Too users to share and collaborate is the entire purpose of this blog, so we are thrilled to see our vision of a robust and active BI Tool user community coming to life!
This month, Denver Public Schools generously agreed to contribute this month’s BI Tool Blog entry. Bruce & Peter from the Accountability, Research & Evaluation (ARE) department at DPS share their seriously impressive “ACCESS Can Do” BI Tool Report. Before you read all about the “Can Do” report below, I’d like to highlight one, very important statement from this month’s entry: “This report has saved teachers countless hours.”
It would be hard to overstate just how important it is to use technology, whenever we can, to save educators time. Any report that can automate time-consuming work so that teachers, counselors, and administrators have more time to spend with kids is a huge win. Reading about how DPS has used the BI Tool to save teachers time reminds me what this work is all about.
Please join Illuminate’s BI Tool User Community by following this link! (To participate in the forum, login to Illuminate, click your Control Panel, select “Illuminate Help Center,” and click on “Community.”)
If you are interested in contributing to the BI Tool Blog, please email me at: freyherme@illuminateed.net
Sincerely,
Franck Reyherme
Director of Business Intelligence Services
*****
ACCESS “Can Do” Report
By: Bruce Little & Peter Tardif
Denver Public Schools (DPS) is currently in year 2 of Illuminate DnA implementation and continually exploring ways to best utilize the product to improve student achievement while reducing teacher work time. The report we highlight below is one of our best attempts in achieving these goals. Before we dig into the specifics, it is helpful to know a little context about our district. DPS is comprised of more than 200 schools, including traditional, innovation, magnet, charter and alternative education schools, with a current total enrollment of more than 91,000 students. Of those, 56% of the school district’s enrollment is Hispanic, 23% is Caucasian and 14% is African-American. Additionally, 69% of our students qualify for free- and reduced-price lunches. Spanning demographics, roughly 37% of our students are English Language Learners, making the report we’ve chosen to highlight a critical support for our teachers in focusing appropriate instruction toward groups of students.
In the central office, the Accountability, Research & Evaluation (ARE) department provides expertise and guidance in the collection, analysis, and communication of student and school academic results to school staff, families, district leadership, and the community. We serve as a resource for assessment development, proper administration procedures, data collection, reporting, and analysis to inform instruction and improve student achievement.
Bruce started working in ARE about two years ago. Previously, he had worked in healthcare, higher education, and financial services in similar data analytic and report development roles. Peter also works in ARE and is a former English teacher who now partners with schools to help them develop sound assessment strategies and implementation practices utilizing Illuminate DnA.
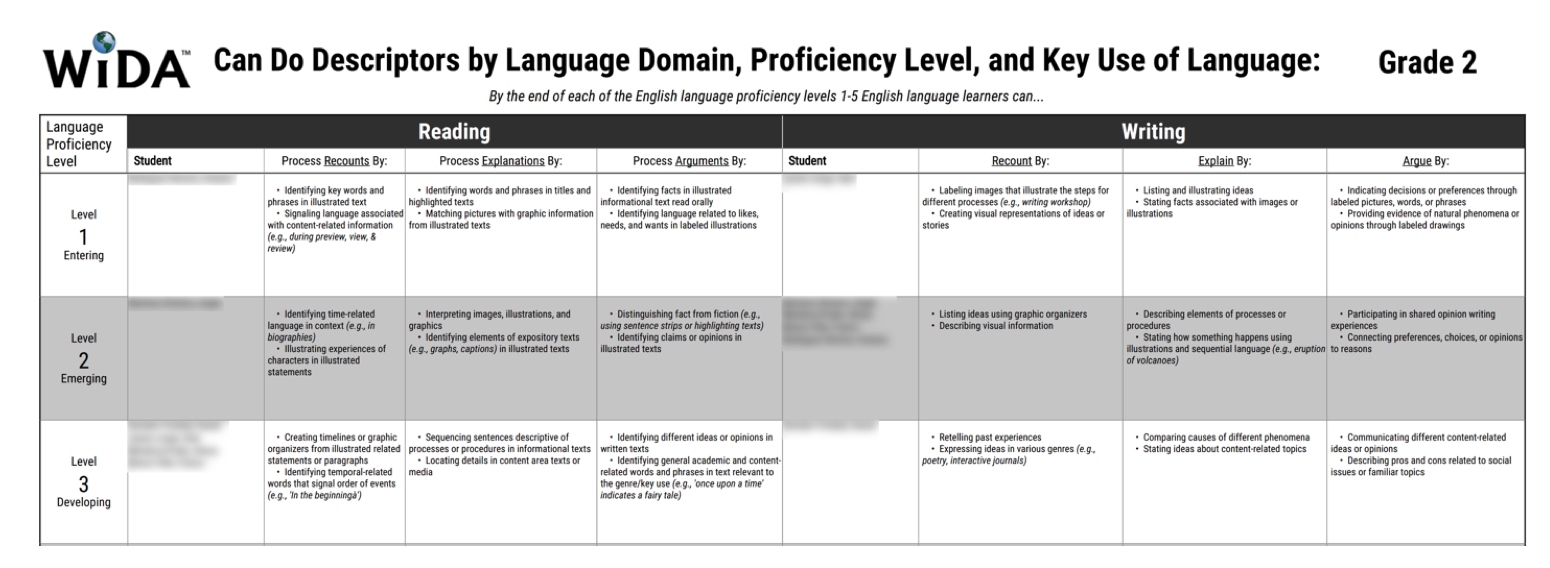
Our version of the ACCESS Can Do report is based on the work of Becky Linderholm of the Eau Claire Area School District, which dictated many of our design decisions because the request was to reproduce the design of those reports as closely as possible in our online environment. Our teachers had been printing blank copies of those large-format reports at the beginning of the school year and writing their students’ names into the grid by hand to indicate where they fell in skills, based on the results of the previous end-of-year ACCESS test. Our report automates this process by filling in the skills grid along with student names and a Long-term English Learner (EL) indicator for them. This report has saved teachers countless hours they can now better allocate towards their beginning of year preparations. It is part of a suite of separate ACCESS related reports that: summarize the students’ scores in a classroom; provide a detailed list of proficiency results by student, and; indicate if a student is on or off track a custom DPS Trajectory metric for achieving proficiency (requires multiple years of ACCESS results for calculation). DPS’s ACCESS Trajectory measures the progression of students’ language acquisition. Trajectory results are tailored to each student, as they take into consideration the unique path to proficiency each student is on. Target setting is clear and actionable as Trajectory results can be used in conjunction with the WIDA Can Do Descriptors to determine needed instructional support or interventions.
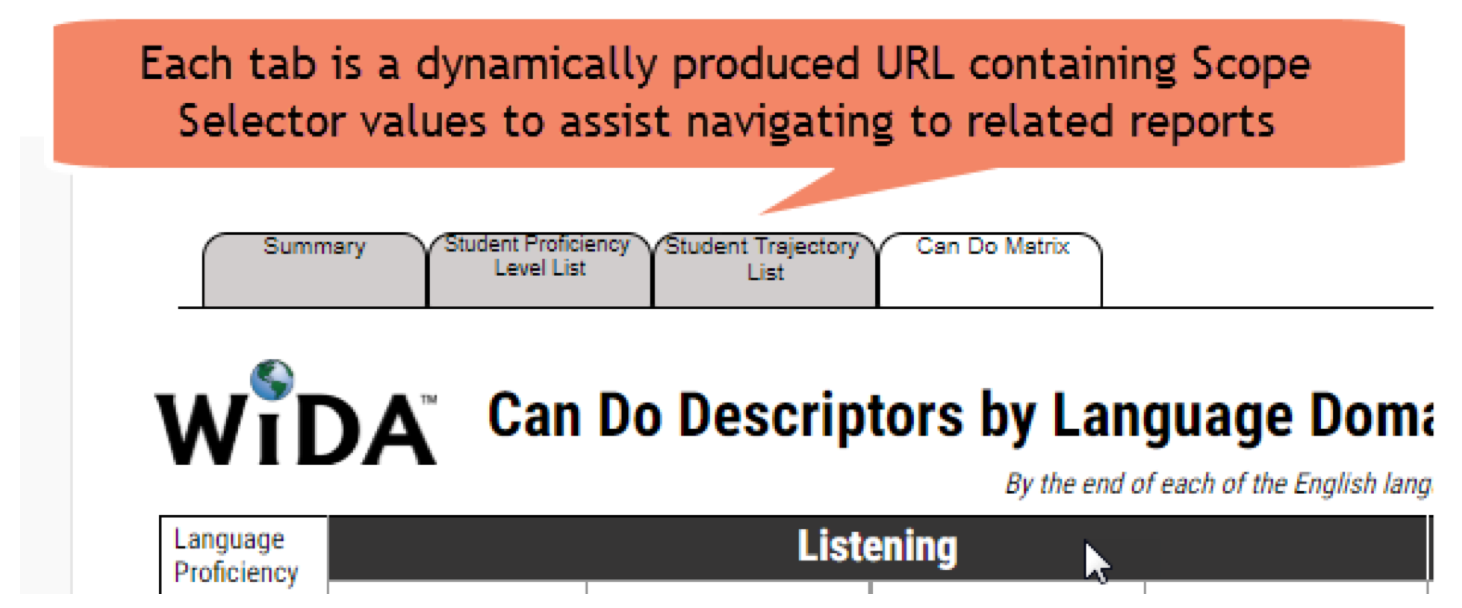
Navigation between these reports is facilitated by a series of hyperlinks embedded in text fields formatted to resemble file tabs—we pass parameters from the scope selectors from one report to another so teachers can examine each of the reports in the context of their chosen population by a mere click of a tab:
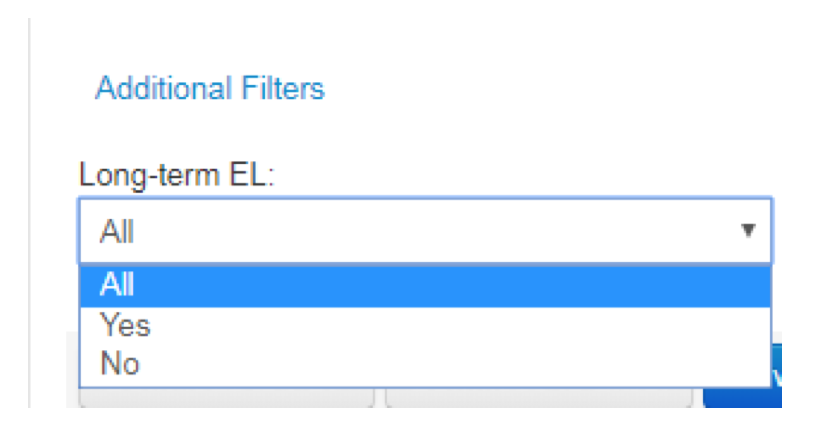
To allow further narrowing of the scope, we’ve added a custom selector to filter the reports by whether or not the students fall into the Long-term EL category, defined as one who has been enrolled in the district for 7 or more years, is Off-track on Trajectory, and is not yet proficient on Colorado Measures of Academic Success (CMAS) Literacy:
This report had no shortage of challenges and one of the first was how to condense five distinct reports with unique descriptors for skills achieved based on bands of grade levels to one report definition that could display the appropriate grid of skills based on the grade selected. While Jasper can support many data sources, most of those proposed to hold the grade level proficiency descriptors were rejected to preserve Illuminate’s security and performance standards. After working with Franck on several ideas, we settled on a data adapter referencing a Google Sheet stored securely within the district’s Google Drive environment. It ended up being a 140 by 17 grid to provide for six levels of skills achieved per grade split into skill groupings that span two pages in the finished report (so roughly 12 rows per grade level):
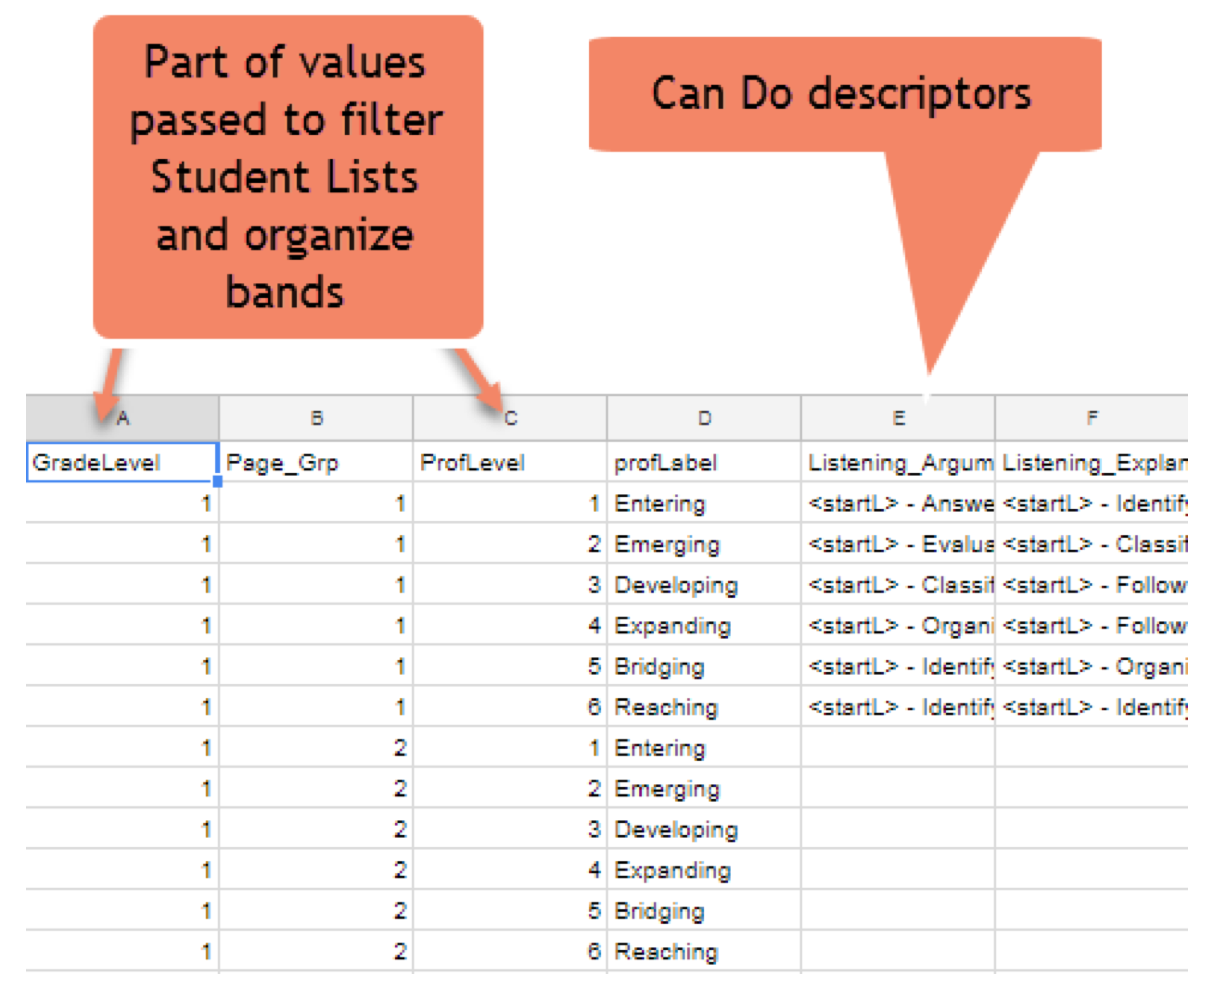
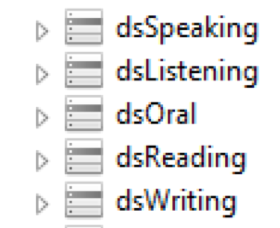
The next challenge was to extract the information for the appropriate students to insert into the appropriate cell of the grid based on their grade and test results. This was achieved by developing five separate SQL data adapters, one each for Speaking, Listening, Oral, Reading, and Writing skills. The grade level, proficiency level, visibility and, if requested, Long-Term EL values are passed as parameters to these data adapters:
…and the results are displayed in tables embedded in cells in the grid that expand to accommodate the number of students that scored in that proficiency level and skill:
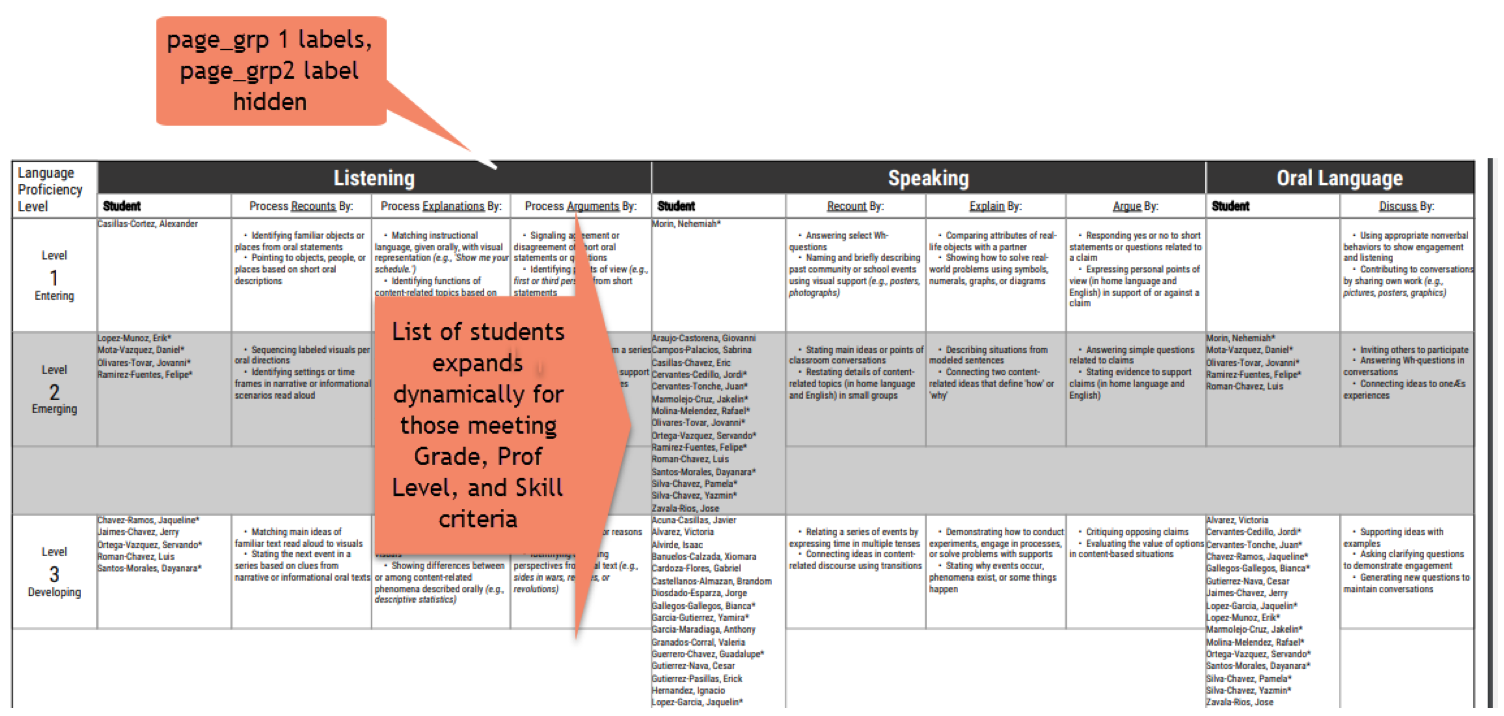
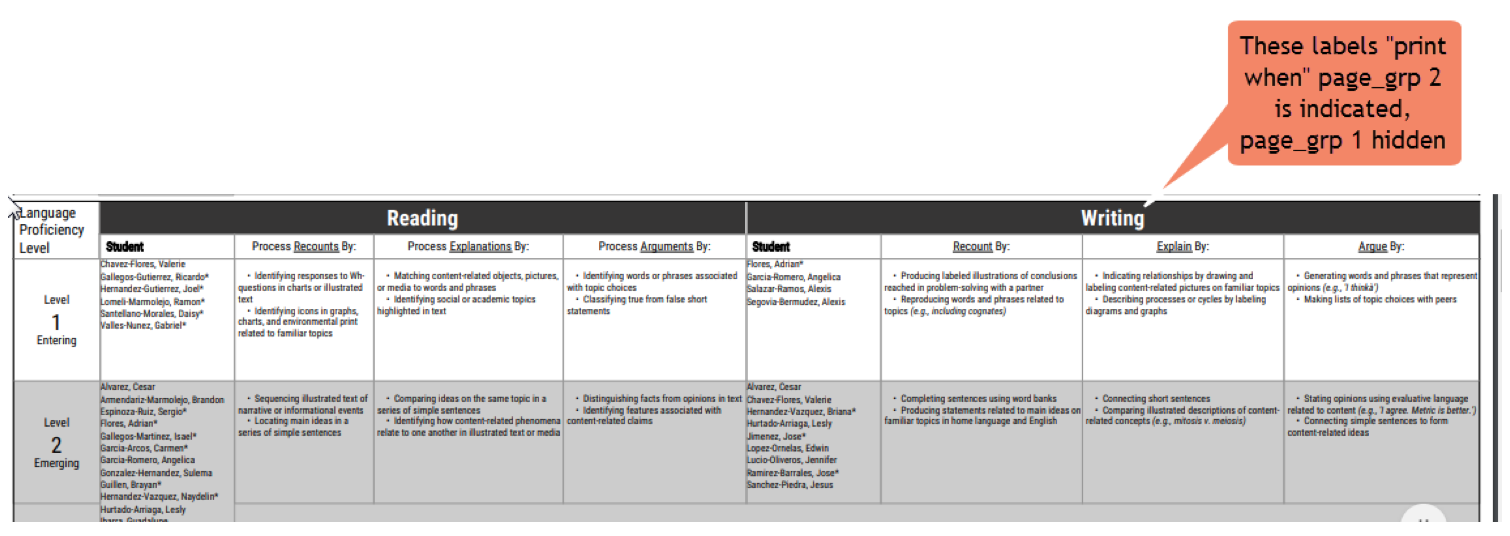
Finally, since each page of the original reports share some elements, we used the “Print When Expression” to either suppress or display the appropriate grid labeling (in a Group Header) based on the “page_grp” value in the descriptors data; for example Listening, Speaking and Oral are displayed on “page one”, while Reading and Writing are on “page two”, but to Jasper, they are group header bands to display or hide on one page definition based on the current value of the page_grp value. In one break from the original report design we were modeling, we added alternating conditional formatting colors, using the Style attribute, to the group footers containing the dynamic student lists so that when the lists expand beyond the descriptors it is still clear which band they are in.
Feedback: Our teachers really like this report and state:
- “…Network 4 schools loved the WIDA report. All of them used it at the beginning of the school year to group and differentiate their instruction….”
- “…My ELD team leads provide the list for teachers at the start of the year and we show them how to access the information on line. It helps a lot with grouping and scaffolds. …”
Some constructive feedback we received but have little control over is the fact ACCESS is only given once a year, so the data in the report becomes stale rather quickly. However, we’re now investigating how we might integrate other assessment data to keep the report more relevant through the academic year.
Bruce’s final thoughts: I like the report a lot because of how developing it, which much guidance from Franck, acted as a catalyst for learning many of the great features Jasper offers that can be used in combination to create a rich reporting experience for teachers and administrators. Advice I’d give other developers is to not be afraid to use the “source” view, but be very careful in doing so—save and back-up frequently because small errors can cause the GUI interface to subsequently fail. But using the source view was invaluable when the need arose to make similar changes to many different objects, such as adjusting the SQL for the individual skills data sets, or updating dynamic URLs used in navigating between the related reports. It was also great to use when fine tuning the alignment of typographical features like the width of cells and alignment of different graphical components instead of opening each individually in the GUI interface to update all values.
Peter’s final thoughts: I learned so much from this process, and Bruce in particular, that my team and I have carried over into the other reports we have crafted for PSAT/SAT practice assessments and Student Learning Objectives. Bruce’s innovation of utilizing Google Sheets as a data adaptor pushed me to continually try to innovate and utilize Illuminate to help make a teacher’s job easier. This allows them to focus on the most important aspect of their immensely challenging work: building relationships and changing lives through learning.
*****
Illuminate Education is a provider of educational technology and services offering innovative data, assessment and student information solutions. Serving K-12 schools, our cloud-based software and services currently assist more than 1,600 school districts in promoting student achievement and success.
Ready to discover your one-stop shop for your district’s educational needs? Let’s talk.
