

 Illuminate Blog
BI Tool: Course Recommendation Reports
This month, we highlight just a few of the many fantastic BI Tool reports that have been created by Dina Lefeld, the Assessment and Data Coordinator at Bellbrook Sugarcreek Schools in Greene County, Ohio. Our last post focused on how Illuminate’s BI Tool can be used to automate data work and give educators back some of their time, so they can focus on more important things. Just like Brian Schum at Lammersville Unified, Dina is using the BI Tool to do just that.
Dina describes several “course recommendation reports” that make it “much more efficient” for their staff to “make data-driven instructional decisions.” Dina collaborated with her colleagues to come up with the criteria for these reports, ensuring buy-in and fostering that grass-roots, bottom-up data culture that the BI Tool is all about. These reports automate the process of collecting data from numerous sources (including student grades) and visualize the data in a way that makes it easier for teachers to ingest the data and make sound decisions. Using these reports, educators are identifying students for both intervention and acceleration. These reports may not be brimming with fancy charts, drill down, etc., but they are practical and useful. In fact, over the years, these course recommendation reports have become one of the most popular types of reports to create with the BI Tool. These are the precisely the types of reports that Illuminate cannot offer as pre-built, “out-of-the-box” reports due to the custom criteria that these reports require. Read all about Bellbrook Sugarcreek’s course recommendation reports below!
For those that just do not have the time to build BI Tool Reports, please keep in mind that Illuminate also offers a Report Building Service. You can contract our team of experts to build the custom BI Tool reports that your district needs. We’ll work hand-in-hand with your team to make sure your vision comes to life and your reporting and data visualization needs are met. Email rbs@illuminateed.com, and we’ll set up a meeting to discuss your reporting needs.
Please join Illuminate’s BI Tool User Community to collaborate with Illuminate BI Tool users throughout the country. Simply follow this link and click the “Follow” button at the top. (To participate in the forum, login to Illuminate, click your “Control Panel,” select “Illuminate Help Center,” and click on “Community.”)
If you are interested in contributing to the BI Tool Blog, please email me at: freyherme@illuminateed.net
Sincerely,
Franck Reyherme
Director of Business Intelligence Services
Illuminate Education
*****
Course Recommendation Reports
By: Dina Lefeld, Assessment and Data Coordinator, Bellbrook Sugarcreek Schools
I am honored that Franck has asked our district to highlight some of the reports we are using to analyze student data and ensure our students’ continued growth. I am the Assessment and Data Coordinator for Bellbrook Sugarcreek schools, a suburban district located in Greene County, Ohio. We currently have over 2700 K-12 students spread into 4 buildings. We are a high performing district earning an overall A award on Ohio’s state district report card. This places us in the top 5% of performing schools in the state of Ohio. The teaching staff in our district has an average of 18 years of teaching experience and 74.5% of our teachers have advanced degrees.
I have a masters degree in Educational Technology and 10 years of educational experience. Six of those years I spent in the classroom as a high school math teacher. I also have 7 years of experience in the private sector working with data warehousing. I typically use SQL queries with the BI Tool because I can do it more efficiently, but the reports I am highlighting could be done using custom reports. This is the first year that we are utilizing the BI Tool to create reports for analyzing our data and it is becoming a game changer for our district. The reports are making it much more efficient for us to analyze and make data-driven instructional decisions.
Every spring I get requests from our math teachers, science teachers, and counselors for student testing data. They analyze the data to make informed recommendations for next school year’s class placements and intervention programs. The course recommendation reports created through the BI Tool give us an opportunity to see consistency in student performance, highlighting students that have some inconsistencies so we can question what really is going on with the child and/or instruction.
The course recommendation reports are just a starting point for us. I am in the process of creating more detailed reports to delve deeper into individual students. I worked with our math and science team on creating the criteria for the reports. We assigned point values to each of the data points to come up with a point value for each student and an action item descriptor for each student. There are additional data points included in the reports that do not have values assigned to them and thus do not have any color coding. It was decided to put them in the report to add more information for the teacher to see.
The students that fall in the ‘Alt Plan Recommended’ zone may need to be in some of our intervention programs. ‘Additional Review Needed’ students we consider borderline. The report lets us know we may need to look at the testing data in a little more detail to see where we can help them succeed. Our ‘Stay the Course’ students look to be in the proper placement path to continue to grow in their learning. If a student falls in the ‘Ready to Challenge’ area we are looking into potential acceleration or enrichment activities when available.
Below is an example of our high school and middle school math report:
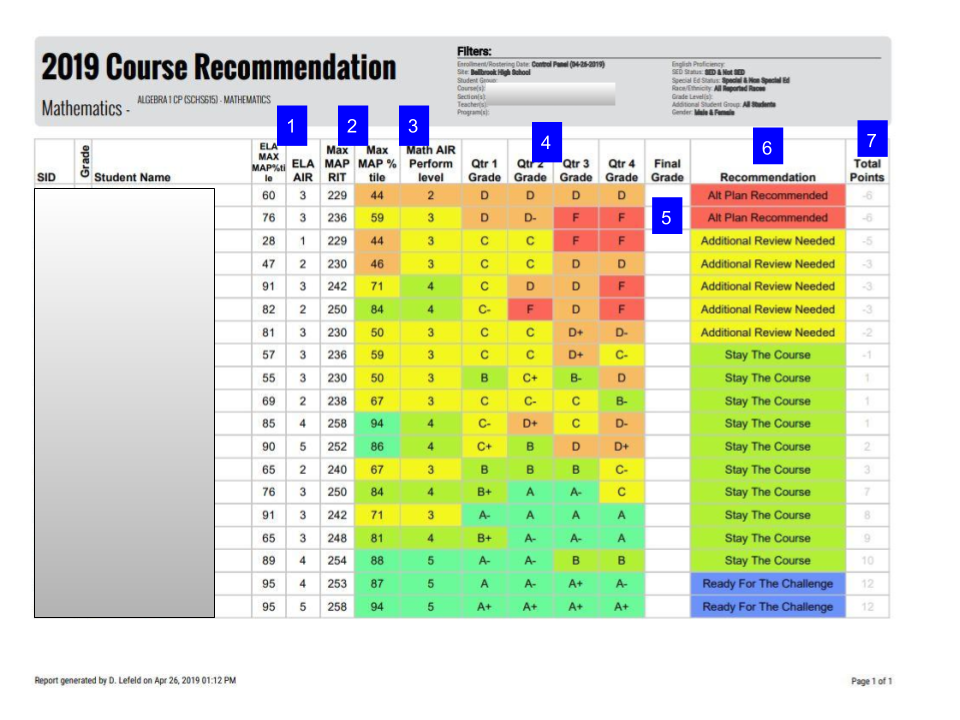
- NWEA MAP Reading percentile (maximum percentile for the current school year) and ELA AIR (state test) performance level (most recent reported ) are included for additional reference only. No color coding including because the scores do not count toward recommendation points.
- NWEA MAP Math data – maximum MAP RIT and percentile for the current school year. Only the percentile is counted toward the recommendation points.
- Most recent reported Math AIR (state test) performance level
- Quarterly grades for the course selected.
- Final Grades – when available, will populate in this column.
- Recommendation descriptors based on the Total Points scored (column 8)
- Total points are calculated using a point system for the color-coded columns. The column is for reference only and may eventually be removed from the report.
Our Science report is used primarily for our students currently taking Physical Science as a freshman in preparation for Biology intervention recommendations for the next school year. Biology is a state tested course in Ohio. We are pulling some different data points in this report:

- ELA AIR performance level for the most recent reported administration.
- NWEA MAP Reading data – maximum MAP RIT and percentile for the current school year. Only the percentile is counted toward the recommendation points.
- Most recent Science AIR performance level reported. Could be from 2 years ago.
- EVAAS projected percentile for Biology EOC (End of Course) exam (counts toward points). EVAAS projected probability of proficient on Biology EOC (not counted toward points). EVAAS data is provided by the state to look at a student’s past performance and predict how they will perform in the future.
An example of the point distribution and color coding we used are listed in the spreadsheet below. This is our first year for this report so we have asked for feedback from teachers and counselors on potential changes to point assignments.

*****
Illuminate Education is a provider of educational technology and services offering innovative data, assessment and student information solutions. Serving K-12 schools, our cloud-based software and services currently assist more than 1,600 school districts in promoting student achievement and success.
Ready to discover your one-stop shop for your district’s educational needs? Let’s talk.
