How to Grow Data Literacy for Whole Child Data
Within an MTSS framework, we have a great opportunity to understand the intersection of all student data—including academic, attendance, social-emotional behavior, and intervention data—and dig deeper to find the meaning within our evidence and understand the stories our data tell. But in order to do that, we must have a working understanding of our data.
We hear a lot about developing assessment literacy, but within the context of MTSS, we really need to develop whole child data literacy. In this post, we’ll recommend two main steps to take when growing your data literacy around whole child data.
Growing Data Literacy Step 1: Identify the Data Your Team Cares About
Not every team needs or uses the same data. Some team members or schools might even be using data or assessments that you aren’t yet aware of. As a team, ask these two critical questions: What data are needed for our purposes, and where do they live? The importance of this step is that it helps your team pinpoint which data sources you need to develop data literacy around.
Let’s look at two examples. A district-wide assessment team might be tasked with monitoring progress toward district and school goals (like unified improvement plans or school improvement plans) and making recommendations for instruction, curriculum, and assessment. This team needs larger scale summary-level data for grades, schools, and the district. For this work, they might need:
- Academic, including summative (like state standards assessment, ACT, and SAT), interim assessment data, and standards-based reporting
- Attendance and behavior pattern data
- School climate data
- Longitudinal data across grades and schools (multiple years) to look for patterns and trends
Alternatively, a district might create Student Support Teams (SSTs) or Intervention Data Analysis Teams (DATs) to identify students in need of additional support and monitor their progress. These teams need more student-centric data. This type of team might use:
- Academic (universal screening, progress monitoring, class grades, recent interim and common assessments)
- Attendance, behavior, social-emotional data
- Intervention data (fidelity, attendance, engagement)
- Longitudinal data for a specific student or group of students (multiple years) to look for patterns and trends
Different teams may need different assessments or measures. Or they may use some of the same data sources but have different questions around those data. Again, the first step is to identify what matters to your team. Which assessments, what other measures, and at what level are they pertinent? Do you need to be more zoomed-out or zoomed-in with your approach?
To support this work, try using a “Data Inventory.” This is a simple document to help organize all of the main data sources and answer key questions about each.

Growing Data Literacy Step 2: Use the 4 C's to Develop Literacy Around Those Data Sources
After completing Step 1, the next step is to grow data literacy around the identified data sources.
For this process, try the “4 C’s” exercise (download a free template from our Comprehensive Assessment System Toolkit.) This entails taking each assessment or measure identified in your data inventory and running it through the 4 C’s: content, construct, context, and culture.
Content:
Here, you are essentially identifying what is being measured. For example:
- What content or subjects (e.g., ELA, Math, social-emotional)?
- Does it align to standards?
- Do we have other data sources that measure the same content?
- What is the purpose of the assessment or measure?
Construct:
Define and understand the structure of the data produced.
- What are the major score fields (proficiency levels, scale scores, percentile rank, competencies)? What do they mean?
- Does it include subscores?
- Is it norm-based or criterion-referenced?
- If it’s an assessment, has it been re-scaled recently?
Context:
The context surrounding the assessment or data collection can have implications on the data themselves.
- What time of day? Was it administered in a new physical environment?
- How often? Where were we in our curriculum at time of data collection?
- If it’s an assessment, how long is it?
- What is the format (online, paper, observation)? Is it adaptive?
- Does the format/length differ from how these skills are usually practiced?
Note that assessment fatigue is a real factor, particularly for younger students who haven’t built up their stamina yet.
Culture:
Evaluate your attitudes and valuation toward these data.
- Do we value these data as a school/district/team?
- What do we use them for?
- Do we trust them?
- Do we have preconceived notions about them?
- Do students have the option of opting out? If so, do we have a high percentage?
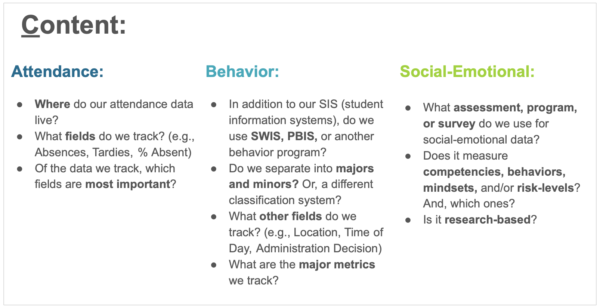
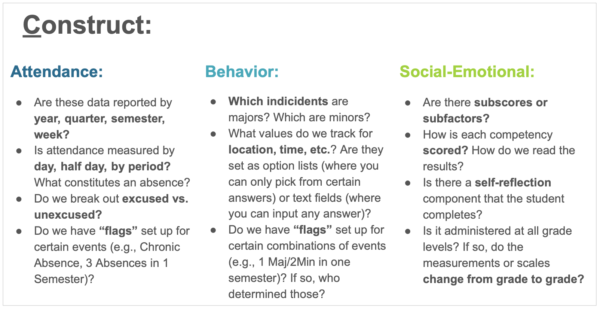
As we said, in the context of MTSS, our teams are looking at academic and non-academic data in order to better understand and better support the whole child. Thus, you should include those non-academic data sources, like behavior and social-emotional, in your 4 C’s work. What might that look like?
Here are some examples:


You can tackle this as a team, or assign various members to take an assessment or measure before sharing out with the group. Regardless of method, the act of going through these 4 C’s will grow your data literacy by leaps and bounds.
Final Thoughts on Growing Data Literacy
Taking the time now to grow your data literacy around the whole child is worth the effort. Your entire team will benefit from the effort to build capacity, and the students will get the support they need to ensure a healthy, safe, and engaging environment for long-term success.
Would you like to learn more about enhancing your literacy around whole child data? Check out our on-demand webinar recording.
*****
Illuminate Education partners with K-12 educators to equip them with data to serve the whole child and reach new levels of student performance. Our solution brings together holistic data and collaborative tools and puts them in the hands of educators. Illuminate supports over 17 million students and 5200 districts/schools.
Ready to discover your one-stop shop for your district’s educational needs? Let’s talk.

