

 Illuminate Blog
Asking Better Questions with Data
School systems today don't lack for student data. Teachers and administrators are flooded with information from summative and interim assessments, as well as universal screening data, classroom grades, attendance, behavioral data, and more.
The challenge for educators is: How can they use all of this information to drive better outcomes in their schools?
Data don't just answer questions—they can inform questions as well
Asking better questions is the key to more effective data-driven decision making in schools. Only by understanding the root causes of a problem, such as why a particular student or group of students is struggling, can educators develop a solution that works. But what does this really look like?
Here are tips for how teachers and administrators can use student data to ask better questions that bring to light the root causes of problems they'd like to solve.
Step 1: Schools need reliable, consistent data
The first step is ensuring that educators have high-quality data on which to base decisions. Before using data, ensure that your data are:
- Valid: The test or item accurately measures the construct, skill, or domain it purports to measure.
- Reliable: The assessment's results or data are statically stable and consistent across many administrations.
- Easily accessible: If data are to be used to drive decisions, they must be at the fingertips of educators.
- Complete: All whole child data must live in one place—educators cannot lose time to compiling data across systems, binders, and spreadsheets.
- Consistent: Ensure that grading practices are uniform and that grades are consistently added.
Step 2: Look for and follow patterns in data
Once you have reliable and consistent student data, you can do a deep dive to look for patterns and anomalies. Let the data drive the conversation and consider the whole child when asking questions. A good way to start is by looking for inconsistencies across multiple data sources using a data visualization tool, such as eduCLIMBER.
An example: Comparing assessment data with course grade data
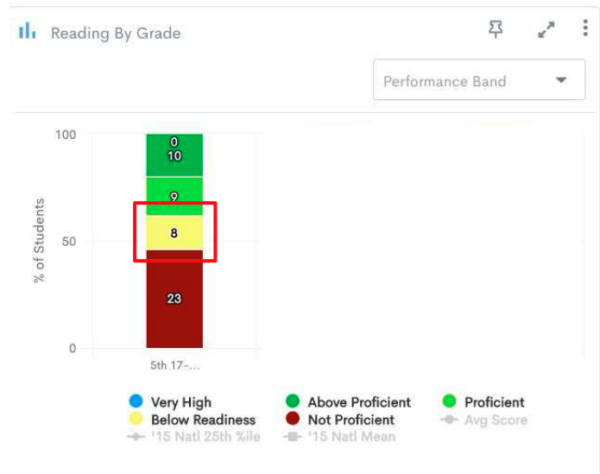
Let's look at an example, starting with data from a universal screening assessment. This graph shows data from a fall reading assessment for fifth-grade students.
There are many different components of the graph we could look at, but here we'll focus on the eight students who are just below proficiency (as indicated in yellow). They're extremely close, but not quite there. Our question is: what do those students need in terms of instruction and supports to reach proficiency?
First, we need to know why they were just below proficiency on the assessment. To explore this question, we should compare results across multiple measures.
For instance, we might start by exploring these students’ class grades. Doing this, we see there are three students who scored below proficient on the reading exam, but are advanced in the class (those indicated by the blue bar):
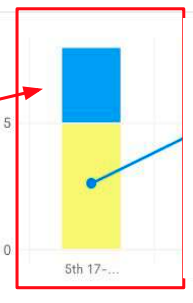
Why is this? We would expect to see consistency between their class grades and their performance on the assessment. Let’s dive in deeper to see if we can determine why there’s a disconnect between these students’ performance in class and performance on the assessment.
Diving Deeper
The disconnect could be unrelated to academics. Maybe a student forgot to wear her glasses that day, or perhaps she was having a bad day outside of school. Maybe these students just aren’t comfortable with online testing. In that case, you might try assessing them again at another time or in another environment.
However, let’s continue digging into the data to see if we can uncover any other possible sources for the discrepancy.
Is attendance the problem?
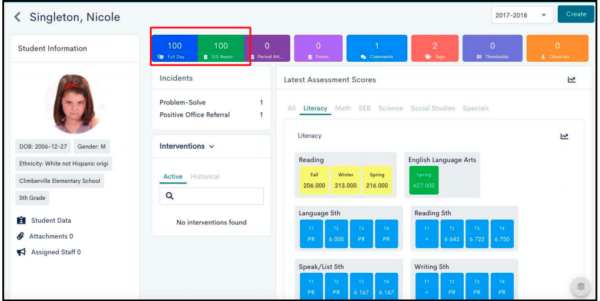
Here, we can see that attendance isn’t a problem for this student, as she hasn’t missed any days of instruction—so we can take that off the table as a possible root cause.
So, where might we go from here?
We could go through the same process to isolate other variables to see if they might be related to the problem, using data sets such as participation data (time logged into educational software and other usage data), class work, behavior, health/medical information, and more.
The idea is that we’re looking for correlations that could give us some possible action steps we might take to address the true barrier to proficiency—not just a symptom.
Find the story within data
The data are going to tell you a story. By following the data where they lead, your team can arrive at concrete actions that are based on the data—that is going to be the game changer.
To learn more, I invite you to watch my recent webinar Asking Better Questions with Data, or learn more about eduCLIMBER and how it facilitates better data-driven decision making in schools.
*****
Illuminate Education equips educators to take a data-driven approach to serving the whole child. Our solution combines comprehensive assessment, MTSS management and collaboration, and real-time dashboard tools, and puts them in the hands of educators. As a result, educators can monitor learning and growth, identify academic and social-emotional behavioral needs, and align targeted supports in order to accelerate learning for each student.
Ready to discover your one-stop shop for your district’s educational needs? Let’s talk.
