

 Illuminate Blog
How to Create Social-Emotional Learning (SEL) & School Climate Dashboards to Support Student Growth
Our primary role in education has always been to ensure that students have the academic skills that they need. Over the past decade, we have seen students walk into our doors and into our schools, needing more instruction in the areas of social skills, emotion, regulation, and behavior. And now, more than ever, we need a way to address these needs in our students.
In this blog, we’ll dive into social-emotional learning (SEL), school climate and culture, and why these concepts are so important in our current school environment.
What is Social-Emotional Learning (SEL), School Climate, and School Culture?
Social-emotional learning (SEL) is the process through which students and adults understand and manage emotions. It is how they set and achieve positive goals, feel and show empathy for others, establish and maintain positive relationships, and make responsible decisions.
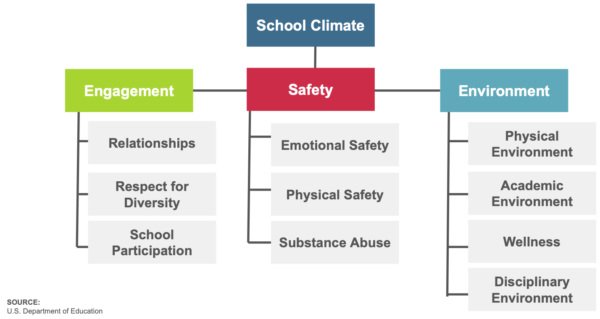
School climate is the physical, social, and emotional environment. It is the result of many factors but can be summed up by how engaged students are by their teachers, how welcomed they feel by their peers, and how engaged their family is in helping them succeed in school. School climate represents a really important indicator of student in-school success.
By contrast, when we think about school culture, we are referring to the long-term type of physical and social environment that we have, as well as the values or beliefs of the school.
How Can Dashboards Help?
When we start to unpack what school climate is, we tend to find that there are key social, emotional, and wellness elements—many of which are currently impacted by the ongoing school and homelife disruptions caused by the pandemic. By better understanding where those needs exist, and for which groups of students, educators can align the right SEL and school climate supports to clear non-academic barriers to learning. But how can districts take a data-based, strategic approach to this work?
For many districts, data dashboards can be a key part of the solution. Data dashboards provide just-in-time information and they can allow for meaningful action planning, goal setting, and tracking. Educators can visualize and identify the universal and intensified SEL and climate needs so that resources can be allocated where they’re needed.
Monitoring school climate is critical because a positive school climate positively increases social behavior, motivation for excelling in school, healthy self-esteem, and the development of effective conflict resolution skills in students. Conversely, an unhealthy school climate is associated with school absenteeism, truancy, aggressive behavior, and dropout risk.
Starting with “Why”
In order to leverage a dashboard to guide universal supports and resources, we first need to consider the dashboard’s need and purpose. Once the dashboard’s focus is developed, it becomes easier to populate the dashboard with data. With a focused dashboard containing key data that relates to the dashboard’s purpose, creating an action plan actually becomes easier because the dashboard has a narrowed focus.
Considering Your Audience
Once you have identified the dashboard’s focus and purpose, the next step is to understand the audience and that must be kept at the forefront when adding data to a dashboard. For support, download the Using Dashboards to Lead Your District with Data eBook.
So, what data might districts consider using for SEL and climate dashboards?
Data to Consider for a Social-Emotional Needs Dashboard
Brief rating scales and teacher nomination procedures can be used to measure social-emotional behavior. Choose a reliable and valid screener. Consider data you already have. If screening, wait a month or two (especially important this year). Identification does not equal intervention. We know that under normal circumstances, 1 of 5 children experience SEB concerns.
If the purpose of the dashboard is to show a correlation to strong ratings on a social-emotional survey to strong academics, then look at the academic data that is in the system already. This might include risk levels (as measured by a universal screener) and proficiency levels (as measured by a standards-based interim assessment). The dashboard should also show growth over time.
Other data to add to your dashboard might include attendance, behavior incidents, health office visits, counselor visits, and teacher observations.
Data to Consider for a Climate Dashboard
Choose a reliable and valid climate measure that assesses emotional, physical, and behavioral aspects. Ensure measures are provided from multiple stakeholders (families, teachers, students, etc.). Most importantly, use this data in conjunction with achievement, discipline, and attendance data. Ask, “How can this data be integrated into other teams/data collection?” In this manner, it doesn’t become another initiative.
For those districts who have created or are considering creating a school climate dashboard, there are some additional data sources that can help build more focused, meaningful dashboards.
- Survey data, including demographic factors
- Gender
- Ethnicity
- Social & Economic Factors
- Disability Codes
- Academic Data
- Add risk level, proficiency, and growth data for key assessments, such as universal screening and standards-based interim assessments.
- Create assessment visualizations that focus on an aggregate view, and consider disaggregating the data further to filter by specific school, grade, and/or student group. While oftentimes our focus wants to navigate to students who are not yet proficient, it's important to also place focus on those students who remain proficient to monitor their growth.
- Attendance Data
- If students' attendance is increasing, then districts should ideally see assessment scores increase as well.
- If attendance data is not increasing, it's an indicator that SEL needs may need to be addressed.
A range of group-specific and individual considerations must be considered to create a school climate that is responsive to the needs of all students.
Make it Meaningful
Remember that we only want to add data that relates to the dashboard’s purpose and helps in telling the dashboard story. Adding lots of data to a dashboard does not make the dashboard inherently meaningful. Rather, the focus data that’s added to support the purpose of the dashboard is what gives the dashboard its power.
Many dashboard tools, such as Achievement Dashboard, offer additional features to customize dashboards further for more impact. For example, your team could add:
- Meaningful Section Headers: Instead of having a section header describe the data, consider adding section headers stated in question format. Use your headers to get at the heart of the data.
- Organize the Visualizations: As adults, we naturally want to read left to right and from top to bottom. Knowing this, organize the visualizations in a way that tells a story.
- Customized Visualization Sizes: Enlarge key visualizations that draw impact to draw the audiences’ eye to the data.
Take Action
A data dashboard is only as good as the data that populate it. If you’re wanting to create a dashboard to take action and drive change, then it is critical to create a dashboard that is focused on where the changes are needed and why. In this manner, taking action becomes easier because of the dashboard’s narrowed focus.
If the purpose of the dashboard is to create change, ensure your team connects the dashboard to meaningful next steps toward progress. Change is a process, not an event. Try taking these small steps to get to the desired outcome:
- Share the dashboard: Achievement Dashboard makes it easy to share dashboard information with other stakeholders in the district or with the community.
- Discuss the data: Plan some time to review the dashboard with the audience. This gives them an opportunity to voice how the data displayed connects to their own observations.
- Determine a plan of action: Ask your team what should be kept going as is, what should be stopped, and what should start in order to support the needs being seen.
Collaboration helps with any needed buy-in and is easier to facilitate when a dashboard has a clear focus with deep meaning. For assistance creating your action plan, download a template in the new Assessing to Accelerate Learning Toolkit.
Want to learn more? Watch our webinar on-demand here, presented by Jaime Harris and Kristin Rockwell.
Illuminate Education’s Achievement Dashboard enables administrators to view key data, monitor initiatives via an equity lens, and share information with all stakeholders. To learn more, reach out.
*****
Illuminate Education equips educators to take a data-driven approach to serving the whole child. Our solution combines comprehensive assessment, MTSS management and collaboration, and real-time dashboard tools, and puts them in the hands of educators. As a result, educators can monitor learning and growth, identify academic and social-emotional behavioral needs, and align targeted supports in order to accelerate learning for each student.
Ready to discover your one-stop shop for your district’s educational needs? Let’s talk.

Love