

 Illuminate Blog
Using Social-Emotional Behavior Screening Data to Plan Interventions at the Individual, Class, and School Levels
More and more research suggests that it’s not just students’ academic skills that lead to overall success in schools. Students’ social-emotional and behavioral (SEB) skills–their positive behaviors, as well as their suppression of more problematic behaviors–are just as important.
We can say that a student is exhibiting social-emotional behavior (SEB) competence when:
- They display certain skills that allow them to get along with adults and peers, as well as navigate the classroom contexts
- They are not displaying problematic behaviors
- Externalizing behaviors (ex: disruptive behavior, non compliance aggression)
- Internalizing behaviors (ex: depression, anxiety)
In order to measure these skills, districts can implement a universal screening tool that’s designed to measure SEB functioning. Yet one of the most common questions I hear from district teams is: Now that we have our data, what do we do with them?
5 Steps to Screening Data Analysis & Use
There’s no one right answer that will work for every school district. However, there are certain protocols that schools can follow to leverage SEB screening data to understand needs and align sustainable, targeted supports that improve students outcomes.
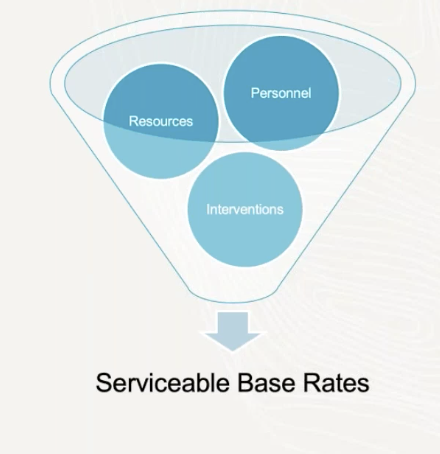
Step 1: Define Serviceable Base Rates
A base rate is the percentage of students who happen to be at risk within a particular environment—whether that’s across the district, within a school, or within an individual classroom.
“Serviceable Base Rates” or “SBRs” can be defined as the percentage of students your team thinks they could feasibly support, based upon existing resources and personnel (school psychologists, social workers, etc.). Districts commonly find that their SBR is 20%. However, the SBR may vary, with some schools finding that theirs is higher or lower.
Step 2: Examine Observed Base Rates
Once the SBRs have been identified, teams will go through a multi-step process to determine whether supports are needed at a school-wide level, class-wide level, or individual student level.
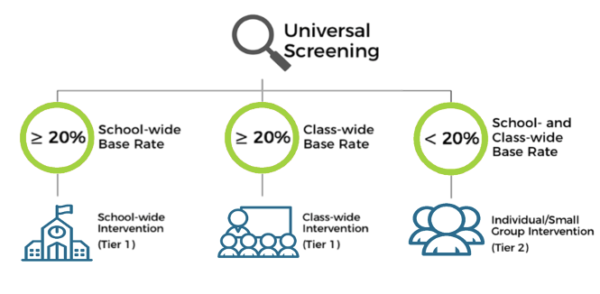
- School-wide Base Rate: First, teams should start by examining how SBRs compare to observed base rates at the school-wide level. If screening data indicate that the percentage of students who are at risk within a school exceeds the school’s SBR, an initial course of action would be to evaluate actions happening in the universal, Tier 1 level. This may include implementing systematic, school-wide interventions for the first time, such as a social-emotional learning (SEL) curriculum or Positive Behavioral Intervention & Supports (PBIS), or adjusting and refining existing supports.
- Class-wide Base Rates: If there is not a school-wide need, the next step is to evaluate base rates within each classroom. If a teacher sees that a higher percentage of students are at risk than the SBR, they can use class-wide strategies that provide support to many students at once, rather than attempting to provide a large number of individualized interventions to students. Doing so also provides useful additional supports to students who may not necessarily be at risk, but can still benefit from the additional supports.
- Individual Students: Finally, after analyzing school-wide and class-wide needs, the last step is to identify individual students who may need either Tier 2 small group or Tier 3 individualized interventions.
Step 3: Examine Subscale Scores to Align Supports
After your team has identified the target for service delivery (school-wide, class-wide, or individual student level), the next step is to examine subscale scores to identify potentially appropriate interventions and supports.
Teams should examine the subscores in their high-quality SEB screening data to determine where the need exists to guide the selection of a grade-appropriate, research-based intervention that is designed to support that specific area of need.
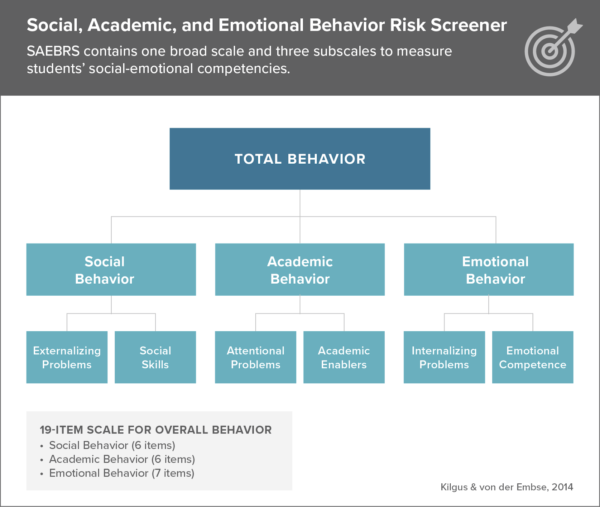
An Example: Social, Academic, and Emotional Behavior Risk Screener (SAEBRS)
For purposes of example, we’ll look at sample data from Social, Academic, Emotional Behavior Risk Screener (SAEBRS). SAEBRS provides a Total Behaviors score, which is a good indicator of an overall student risk. It also shows how students are doing socially, emotionally, and academically. SAEBRS measures both problematic items (indicating the students exhibiting difficulty in one of these three areas), as well as positive items (indicating how students are doing well in that area), to get an understanding of how a student is doing in each of these three domains.
Importantly, SAEBRS also provides the subscale scores which correspond to a student’s social, academic, and emotional functioning. Let’s look at Figure A as an example from a real school district.
FIGURE A:

When examining this report, the team made a few different decisions:
- At the sixth grade level, even though emotional risk levels were somewhat elevated, they focused more on the elevated levels of social and academic behavior problems. This led to them choosing particular supports that are appropriate for sixth graders and aligned with social and academic functioning.
- At the eighth grade level, the school had particularly heightened levels of emotional behavior problems, which led them to choosing supports for students on the emotional side.
There is never one right answer—it’s about using the data to guide your understanding of the schools to supplement your existing understanding of students and classroom level supports.
To explore specific examples of school-wide, class-wide, and individual student supports, I invite you to watch my recent webinar with Dr. Nathaniel von der Embse, which is available on demand here.
Step 4: Integrate Screening Scores with Additional Data Sources
There is additional data we can collect that goes beyond universal screening. By analyzing these data as well, it will help teams determine which course of action is the most appropriate.
- School-wide, Universal Supports (Tier 1)
-
-
- PBIS Fidelity: Ensure that existing universal supports around PBIS are being delivered with fidelity.
- There are many tools available, but the most common ones are Tiered Fidelity Inventory (TFI) and the Benchmarks of Quality (BOQ).
- SEL Fidelity: Examine the extent that the various aspects of social-emotional learning (SEL) Tier 1 instruction are being implemented. For support, look at the CASEL Indicators of Schoolwide SEL Walkthrough Protocol
- PBIS Fidelity: Ensure that existing universal supports around PBIS are being delivered with fidelity.
-
- School Climate Data: Is it possible that SEB is not improving because students do not perceive the school to be an effective and supportive environment?
- Classroom-level Supports (Tier 1)
-
-
- Additional data sources include measures that enable teachers to evaluate themselves with regard to classroom practices, as well as various observation tools and practices.
-
- Individual or Small-Group Interventions and Supports
-
- Functional Behavior Assessments: These are especially useful when we think contingency management interventions might be in order.
- Help discover the “why” a student is displaying problem behavior.
- Research shows that when interventions are function-based, students are more likely to be successful.
- Skill Assessments: Identify the specific skill gap for each student.
- Helps teachers align a support that is most relevant to the student’s need.
- Functional Behavior Assessments: These are especially useful when we think contingency management interventions might be in order.
Step 5: Identify appropriate interventions and supports
To explore this work at the school-wide, class-wide, and individual student level, watch the webinar on demand here.
*****
Illuminate Education equips educators to take a data-driven approach to serving the whole child. Our solution combines comprehensive assessment, MTSS management and collaboration, and real-time dashboard tools, and puts them in the hands of educators. As a result, educators can monitor learning and growth, identify academic and social-emotional behavioral needs, and align targeted supports in order to accelerate learning for each student.
Ready to discover your one-stop shop for your district’s educational needs? Let’s talk.
