

 Illuminate Blog
Turning Tier 1 Universal Data into Action

In a previous post, we briefly discussed the importance of monitoring our Tier 1 Universal instruction.
But many districts struggle with creating a plan of what to do—or with how to turn their findings to action. If there’s a Tier 1 issue, where exactly is it? What do we do about it?
Let’s take a moment to answer some of those questions. We’ll regroup on what Tier 1 Universal instruction is, discuss the data and analytical questions for evaluating Tier 1 effectiveness, and suggest steps to take when there is a Tier 1 issue.
What is Tier 1 Universal Instruction?
Tier 1 Universal Instruction is the high-quality classroom instruction that all students receive (thus, the term “universal.”) The goal is for Tier 1 Universal efforts to be effective for the vast majority of our students (typically 80-90%).
Universal Tier 1 instruction isn’t limited only to academics. In terms of behavior, Tier 1 efforts might include actively teaching positive behaviors to all students. In terms of social emotional learning, Tier 1 efforts might include actively creating situations and opportunities for students to develop the social and emotion regulation skills they need to be successful.
In terms of a tiered MTSS framework, effective Tier 1 instruction ensures that we aren’t escalating an abundance of students into Tier 2 or Tier 3 interventions. In Tiers 2 and 3, resources are more scarce and more costly in terms of dollars, time, and staff. If we allow our Tier 1 efforts to be ineffective, we overload and debilitate our Tier 2 and Tier 3 supports, rather than attending to the source(s) of the problem.

Who typically analyzes Tier 1 Universal data?
The answer varies by district. If you’re just getting started, I recommend forming a dedicated Universal Data Analysis Team (DAT). This team would meet about 3 times per year to check in on Tier 1 instructional impact. This team then shares out findings and next steps to other stakeholders.

Which data should we use when monitoring and evaluating Tier 1 Universal efforts?
By and large, Universal DATs are looking at the data that pertain to all students. For most districts, examples include:
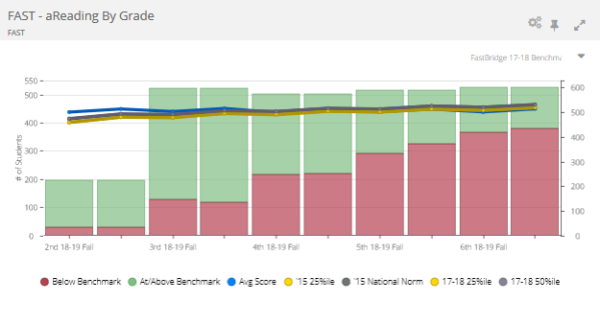
- Universal Screening: Universal screening is the process of gathering academic and behavior data about all the students in a class, grade, school, or district in order to identify which students need additional assistance to meet learning goals. In simple terms, universal screening assessments measure risk. They’re administered at the beginning of the year (and periodically throughout) to all students. Examples include FastBridge and PALS.
- Interim Assessments: These assessments measure students’ proficiency toward meeting district- or state-identified learning standards. They’re typically given seasonally.
- Social-Emotional and Behavior (SEB) Data: At-risk flagging as well as rates of suspension, majors/minors, referrals, etc. as well as
- Attendance Data: Rates of attendance, truancy, patterns in attendance, etc. as well as at-risk flagging.
What questions should we ask when analyzing Tier 1 Universal data? What are some indicators of a Tier 1 Universal issue?
Here are some places to start:
- Universal Screening Data:
- What percent of students are at-risk for academics or SEB?
- Are 70-80% of students at/above risk-level? If not, this indicates a universal issue.
- What percentage of students who were at-risk at the beginning of the year made high growth, average growth, and low growth according to growth percentiles or growth norms? Why might this be?
- What about students who were low-risk at the beginning of the year? How do we know these students are growing?
- Interim / Proficiency Data:
- What percent of students are proficient with standards?
- Is our average (mean) score is lower or higher than the national average score or benchmark level?
- Social-Emotional and Behavior (SEB) Data:
- What percent of students are at-risk as measured by repeat office referrals? Is it higher than 15%? If so, this can indicate a universal problem.
- Is there a particular behavior incident we see most frequently? A particular location or time of day they occur? Is there a particular population of the student body engaging in the behavior?
- Attendance Data:
- What percent of students are chronically absent?
- What percent of students have less than 90% attendance rates? Is the student population it higher than 20%? If so, this can indicate a universal problem.
As a note, there is a difference between a student being at-risk and a student being proficient in a skill. Risk level does not equate to proficiency level. If there is a significant number of students who are identified as at-risk, it is going to be difficult to see growth in proficiency. So if a significant number of students are at-risk at the beginning of the year, decreasing risk level (rather than proficiency) may very well be the focus for tracking growth throughout the year.
What actions can we take if it looks like our Tier 1 Universal efforts need to be adjusted?
The students who walk through our doors change every year. And sometimes, our data shows us that the effective things we’ve done in the past are not as effective for the students in our schools today.
In this case, the next step is to determine what specifically about our Tier 1 efforts needs adjusting.
To do this, consider the academic, behavioral, or social emotional skill/standard on which students are struggling. Consider implementing a class-wide intervention for 15-20 minutes targeting these skills in place of something “we’ve always done” to change the outcome trajectory. Then, ask a few probing questions to help your team pinpoint where the adjustment is needed. Here are a few to consider:
- Patterns: Who is struggling or making significant gains? Is it a particular grade or subgroup? Several? Is a particular cohort/graduating class continually struggling with the same skill year after year? Why might this be?
- Staff Support: Have our educators received adequate training in the curriculum or programs used to teach this skill?
- Instructional Practices: Are we using research-based curriculum or methods to teach this skill? For standards, is this standard taught at the same Depth of Knowledge (DOK) level as it is assessed? Are we using ongoing formative assessment to address learning issues and adjust instruction in-the-moment?
- Learning from What’s Working: What can we learn and apply from our areas of Tier 1 success? Is there a particular teacher or coach with significantly higher results from whom we can learn best practices?
- Screening & Identifying: Is the universal screener that detected this Tier 1 need valid and reliable? Are our attendance or behavior risk thresholds appropriately set?
What are some common barriers to analyzing Tier 1 data effectively?
Here are some common ones that I’ve seen:
- Not knowing which questions to ask
- Using measures for purposes that aren’t their intended purpose
- It takes too much time to find the answers to the questions we’re asking
- Not knowing which data points to use and when
- Thinking only about universal approaches (we can’t get too bogged down in focusing only on Tier 2 and Tier 3, or only focusing on Tier 1)
- Dismissing data because of programming (we need to be as critical of all programs and expect growth for students in special education, intervention, or English Language services)
- Using the data to point out specific teacher performance publicly
- Not considering disadvantaged subgroups. Not just race or ethnicity, but also students who have mental health needs or endured significant trauma. Those students have some disadvantages when they come into our doors. If we don’t have programming and supports in place for those subgroups right out of the gate, there is a missing component in our universal support practices.
Illuminate supports districts nationwide with tools and professional development for monitoring and evaluating Tier 1 practices. Reach out to learn more.
Get agendas, guided data questions, student plan templates, and more in our free MTSS Toolkit:
*****
Illuminate Education partners with K-12 educators to equip them with data to serve the whole child and reach new levels of student performance. Our solution brings together holistic data and collaborative tools and puts them in the hands of educators. Illuminate supports over 17 million students and 5200 districts/schools.
Ready to discover your one-stop shop for your district’s educational needs? Let’s talk.
